- Stellar (XLM) has dropped 14% in 30 days, hitting a monthly low near $0.252 as technical indicators point to a strong downtrend.
- While a slight RSI rebound hints at early buyer interest, the death cross and rising ADX suggest bearish pressure remains dominant.
Stellar (XLM) has plunged 14% in the past 30 days, hitting a new monthly low near $0.252. The steep decline comes amid escalating geopolitical tensions and intensifying technical signals that suggest further losses may be ahead—unless buyers step in fast.
Stellar Battles Oversold Conditions Amid Weak RSI
The Relative Strength Index (RSI) for Stellar has slightly rebounded to 32.63 after touching 26.93 just a day earlier. Despite this recovery, the RSI remains near oversold territory, indicating that downward pressure has merely eased, not reversed. The asset’s rapid shift from near-overbought to oversold conditions in under 48 hours reflects how swiftly sentiment has turned against XLM.
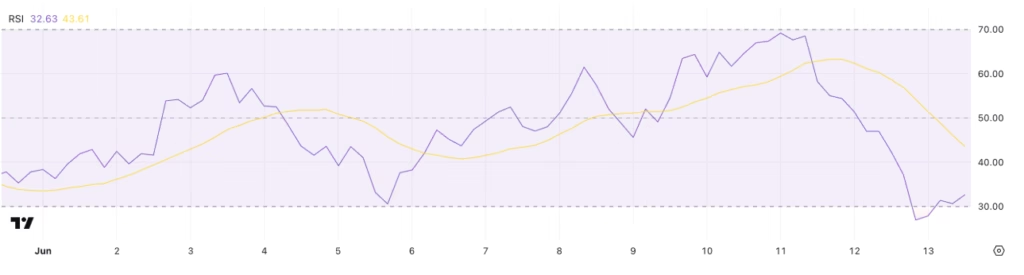
Should RSI continue rising above 40, it might hint at the early stages of a trend reversal. But for now, the market remains cautious, with buyers yet to reclaim meaningful control.
ADX and Death Cross Signal Downtrend Is Strengthening
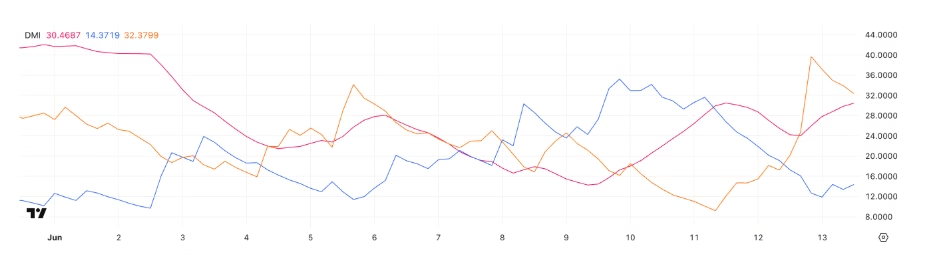
Adding to bearish sentiment is a rise in the Average Directional Index (ADX), now at 30.46, confirming a strengthening trend—currently downward. The Directional Movement Index shows bearish pressure (-DI) still far outpacing bullish interest (+DI), underscoring the dominance of sellers in the market.
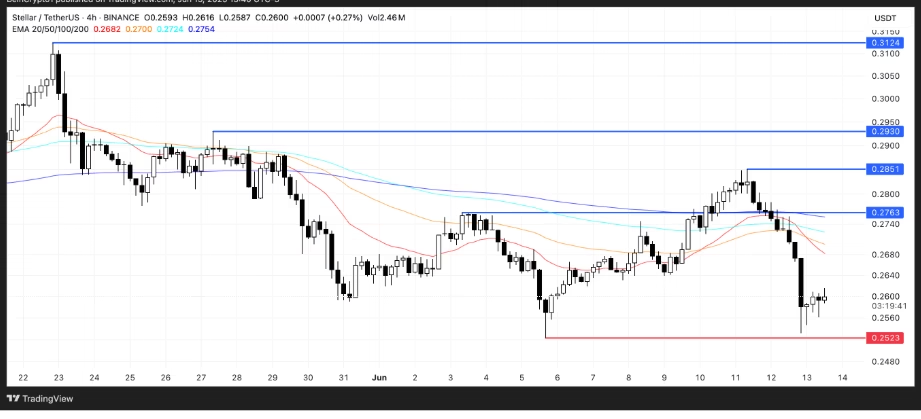
Compounding the negative outlook is the recent formation of a death cross, a classic bearish signal that occurs when the short-term exponential moving average drops below the long-term average. This pattern typically forecasts extended downside, and with XLM hovering around $0.26 at press time, a decisive break below $0.252 could push the token under $0.25 for the first time since April.
What’s Next for XLM?
If Stellar breaks below the critical support at $0.252, it risks falling deeper into bearish territory. However, if the price can regain ground and move above the $0.276 resistance level, a short-term recovery toward $0.285 or even $0.293 could be on the table.
For any sustainable upside, XLM will need a sharp rise in bullish volume and momentum. Until then, the path of least resistance remains downward, with caution warranted for traders eyeing a reversal.
ALSO READ:PayPal CEO Confirms PYUSD Integration with Stellar Blockchain
DISCLAIMER:
The views and opinions expressed herein are solely those of the author and do not necessarily reflect the views of the publisher. The publisher does not endorse or guarantee the accuracy of any information presented in this article. Readers are encouraged to conduct further research and consult additional sources before making any decisions based on the content provided.