

- XRP has struggled to break above the $3 level but shows bullish patterns suggesting a potential rally toward $4.40–$5.80 if $2.95 support holds.
- Falling below $2.95 could trigger a deeper correction toward $2.40.
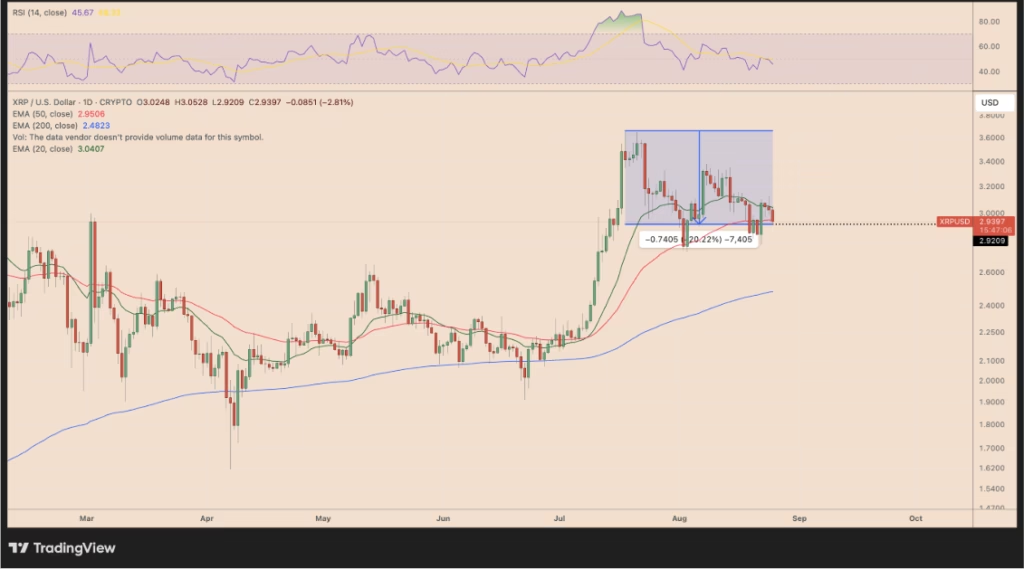
XRP has struggled to decisively surpass the $3 psychological barrier, falling more than 20% since its July peak near $3.66. Despite recent setbacks, analysts remain optimistic about a potential breakout, highlighting technical patterns and key support levels that could drive XRP higher.

XRP Rebound Could Target $4.40
Technical analysis suggests XRP could rebound toward $4.00–$4.40 if it holds the crucial $2.95 support level. Elliott Wave analyst Avi Harkishun notes that this zone, which acted as resistance during mid-2021, has historically become strong support after XRP’s earlier breakout.

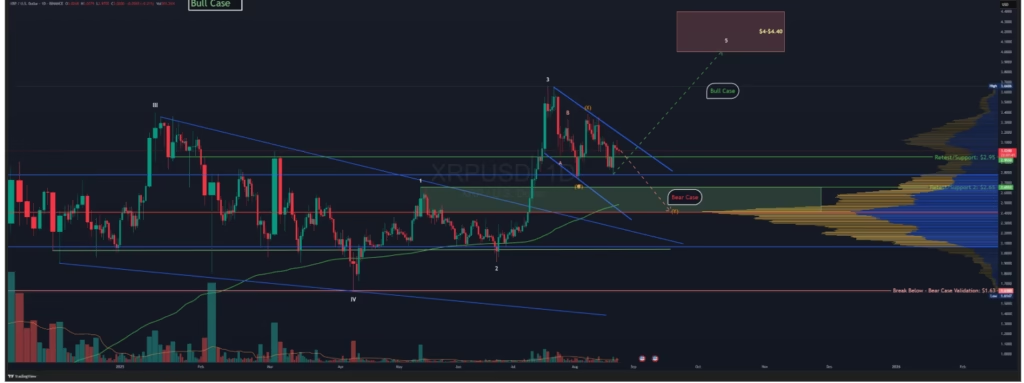
The $4.00–$4.40 target aligns with the 1.618 Fibonacci retracement level measured from the swing high near $3.38 to the swing low around $1.61.

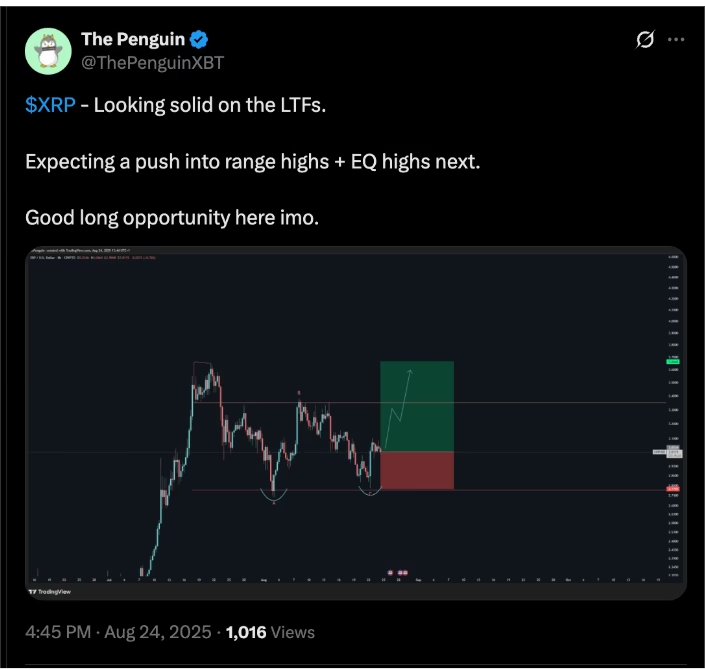
Other chartists, including ThePenguinXBT, view these levels as an attractive long opportunity. Additionally, XRP’s bull pennant pattern hints at a potential upside target near $4.62.

Cup-and-Handle Formation Points to $5.80
Another bullish signal comes from AltcoinGordon, who identifies a classic cup-and-handle formation on XRP’s daily chart. Currently in the handle stage, the consolidation could precede a breakout above the neckline at around $3.80.

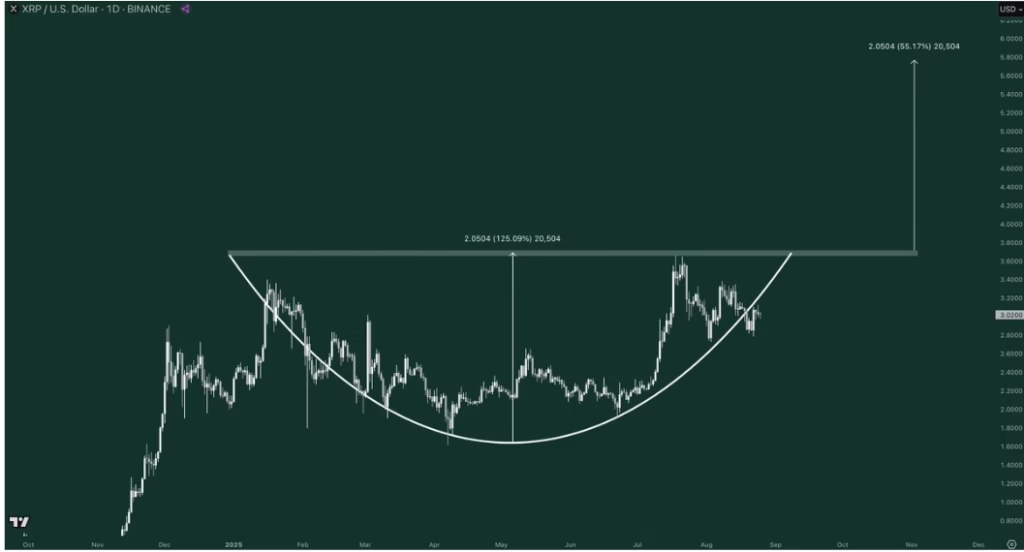
Based on the cup’s depth, the measured move projects a target of $5.80, representing a potential 90% gain from current prices. This formation highlights XRP’s strong technical potential if bullish momentum resumes.
Key Support Level at $2.95
However, the bullish scenario depends on XRP maintaining support at $2.95. A drop below this level could trigger a longer pullback pattern known as a “WXY correction,” extending the decline toward $2.40. This zone aligns with heavy historical trading activity and the 200-day exponential moving average (EMA), offering a potential safety net in a bearish scenario.

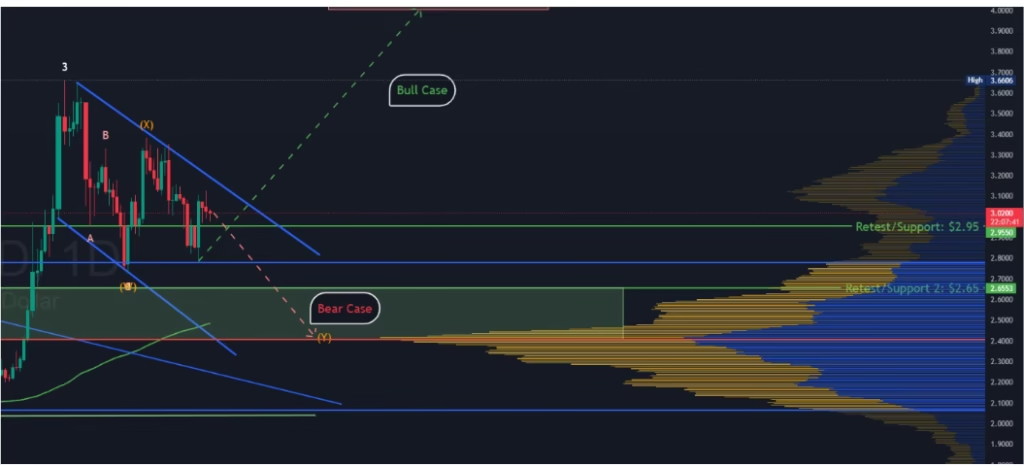
XRP’s near-term prospects hinge on its ability to reclaim $3 as support. Holding $2.95 could pave the way for a rally toward $4.40–$5.80, while failing to maintain this level may lead to a deeper correction toward $2.40. Traders and investors will be watching these key technical points closely as XRP navigates its next critical phase.
ALSO READ:Ripple Partners with SBI to Launch RLUSD in Japan by 2026
DISCLAIMER:
The views and opinions expressed herein are solely those of the author and do not necessarily reflect the views of the publisher. The publisher does not endorse or guarantee the accuracy of any information presented in this article. Readers are encouraged to conduct further research and consult additional sources before making any decisions based on the content provided.