

In the fast-paced world of cryptocurrency, market analysts are constantly on the lookout for patterns that might indicate significant price movements. Currently, Stellar (XLM), often seen as a rival to XRP in the cross-border payments space, is showing signs of a potential major crash, reminiscent of its sharp decline in 2021. If the Bollinger Bands pattern holds, XLM could be on the verge of its biggest crash in three years.
Understanding the Current Market Conditions for Stellar (XLM)
Stellar, co-founded by Jed McCaleb, who also co-founded Ripple, has always been in direct competition with XRP. Both cryptocurrencies aim to revolutionize the blockchain payments ecosystem. However, their price actions have often mirrored each other, with XLM acting as a beta version of XRP.
Recent reports indicate that XRP is set for a significant drop, similar to its 85% nosedive in 2018. This downward trend appears to be influencing Stellar as well. Over the past few weeks, XLM has experienced a substantial decline, and technical indicators suggest that this trend might continue.
Also Read: Stellar (XLM) Death Cross: A Warning or a Bear Trap?
Bollinger Bands Pattern: What It Indicates for XLM
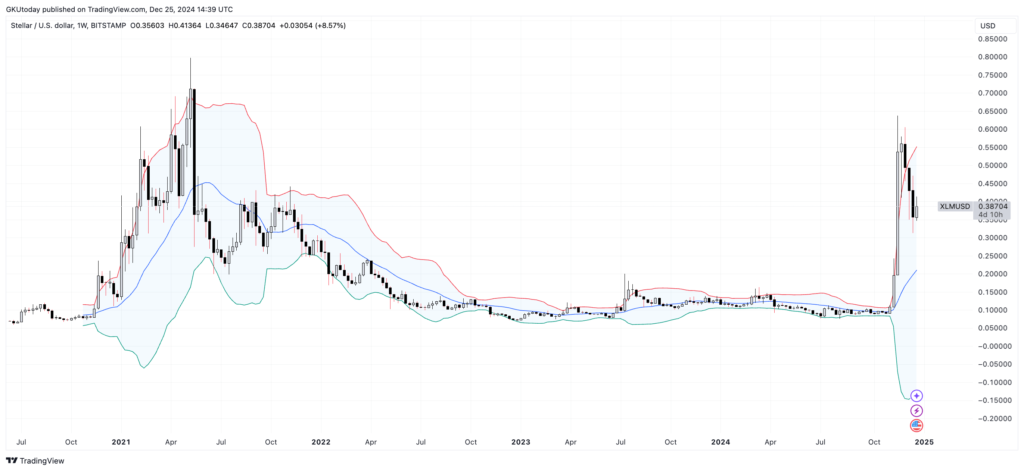
The Bollinger Bands, a popular technical analysis tool, have been pivotal in predicting XLM’s price movements. Bollinger Bands consist of three lines: the upper band, the lower band, and the median, represented by the 20-day moving average. When the price hits the upper band and then begins to decline towards the median, it often signals a potential drop.
In recent weeks, XLM reached and even broke through the upper band high at $0.6374. This movement mirrors the pattern observed in 2021 when XLM hit a high of $0.797 before plummeting by 48.73% in just one week. Currently, the median line of the Bollinger Bands is positioned at $0.21, suggesting that a similar drop could be imminent.
Historical Context and Future Predictions
Reflecting on 2021, the price of XLM dropped significantly after hitting a peak. This historical context adds weight to the current analysis. Over the last three weeks, XLM has already seen a 40% decrease, with its price now at $0.386. If this trend continues and follows the 2021 pattern, XLM could potentially face another 45% dip.
However, it’s essential to note that while historical patterns can provide valuable insights, they do not guarantee future performance. The cryptocurrency market is highly volatile, and broader market tendencies will play a crucial role in determining XLM’s price action.
The potential for a major crash in Stellar’s price is significant, as indicated by the Bollinger Bands pattern. If validated, this could mark the biggest crash for XLM since 2021. Investors and traders should approach this situation with caution, considering both historical data and current market conditions. As always, conducting thorough research and seeking advice from financial experts is crucial before making any investment decisions.


