- XRP’s long-term holders are accumulating again, but historical trends and technical indicators suggest this often precedes price corrections, not rallies.
- A descending triangle pattern on the chart signals a potential 40% decline, with the price possibly dropping to around $1.21.
As the cryptocurrency market continues to shift, XRP’s long-term holders have returned to accumulation mode. While this might initially seem like a bullish signal, historical data and technical indicators suggest otherwise. Could XRP be nearing its peak, or is another correction on the horizon?
The Return of Long-Term Holders
Recent data from Glassnode shows a rise in the “Percent of XRP Supply Last Active 1+ Years Ago,” a key metric tracking dormant coins. After XRP’s impressive rally to over $3 in early 2025, this metric has been climbing again. While it’s natural to interpret this as renewed confidence in XRP, past trends reveal a concerning pattern. Historically, such surges in dormant coin activity often precede price stagnation or even significant corrections.
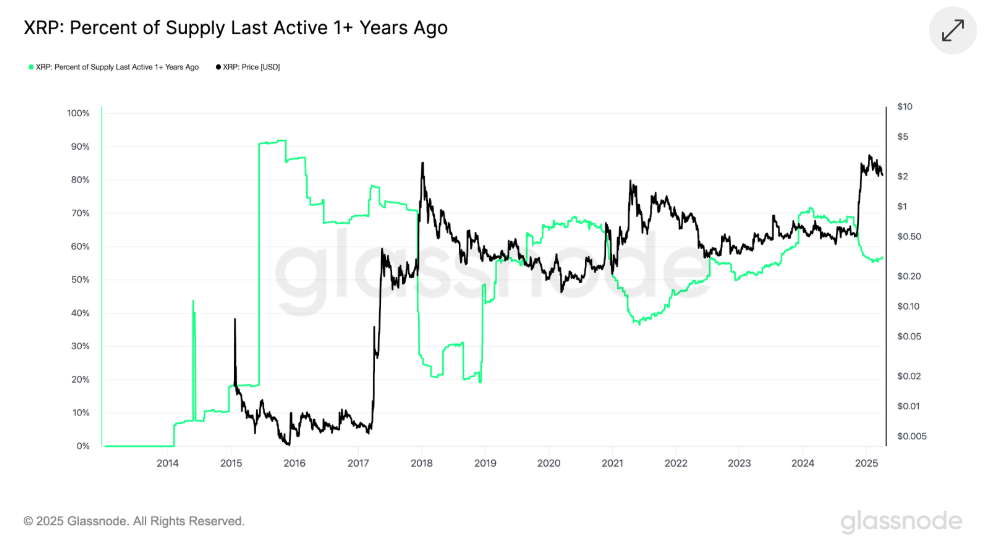
The trend is especially notable since the rally to over $3. In the wake of this surge, long-term holders started selling their XRP, causing a sharp drop in the dormant supply metric. However, by February 2025, this trend reversed, with holders beginning to accumulate once more. Yet, despite the accumulation, XRP’s price has fallen by over 30%, suggesting that long-term holders are purchasing during price dips rather than fueling a new rally.
Historical Precedents for Caution
The current behavior of XRP’s long-term holders mirrors patterns observed during previous bear markets, particularly in 2018 and 2021. For example, in late 2017, XRP saw a parabolic rally that pushed its price to an all-time high of $3.55. However, this was quickly followed by a sell-off when dormant holders returned to market activity.
Similarly, in 2021, XRP peaked around $1.80 before encountering a period of consolidation and downward pressure after long-term holders distributed their coins. Both instances show that accumulation after a sell-off doesn’t always mark the beginning of a new bull run. Instead, it often signifies the peak of the market.
The Descending Triangle and Bearish Signals
XRP’s technical chart further reinforces the bearish outlook. Currently, it appears to be forming a descending triangle pattern on its weekly chart, a formation typically associated with bearish breakdowns. As of April 3, XRP is testing the $1.95–$2.00 range as support. A breakdown below this level could push the price lower, with a potential target near $1.21—a crucial historical resistance level from 2021 that could now act as support.
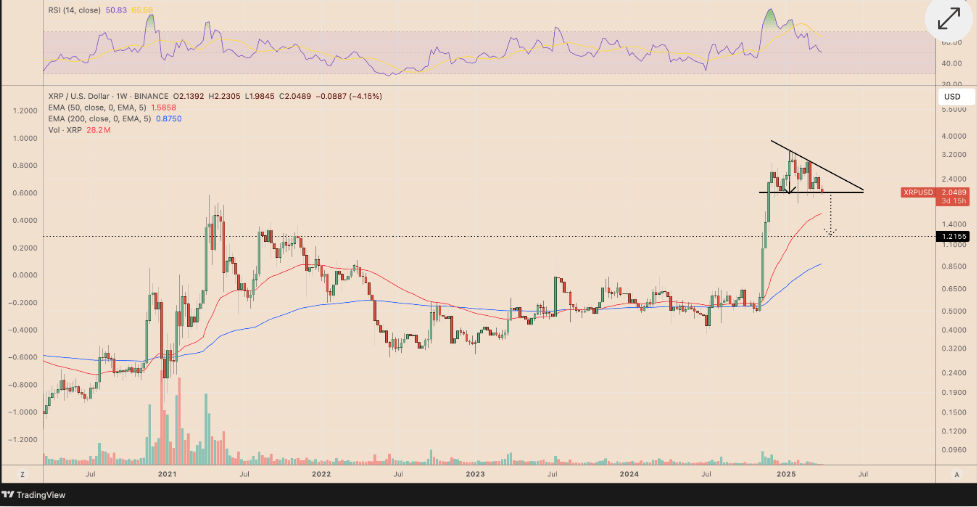
Adding to the caution is the declining Relative Strength Index (RSI), which indicates weakening momentum. Combined with broader market concerns, including external factors like President Donald Trump’s trade tariffs, the outlook for XRP is increasingly bearish.
XRP’s Rough Road Ahead?
While XRP’s long-term holders are accumulating again, the historical and technical data suggests that this may not be the start of a new bull run. Instead, it could be the beginning of a price correction, with potential declines of up to 40%. Investors should proceed cautiously, as the current signals suggest that XRP could be facing more challenges in the near future.