



- Bitcoin faces strong resistance at $81,000–$83,000 after a sharp 25% rally.
- A failure to break higher could send BTC toward $57,000–$60,000, with $50,000 a deeper downside risk.
Bitcoin is facing fresh selling pressure after failing to break above $81,000. BTC climbed nearly 25% in ten days, but the rejection has left traders watching closely for signs of another correction.
Bitcoin reached around $81,200 on August 25 before falling below $80,000. The setback came after a strong recovery from the August 16 low near $62,800, putting the $81,000-$83,000 region at the center of the current Bitcoin price outlook.
Bitcoin Price Pulls Back After Sharp Rally
Bitcoin was trading near $79,535 at the latest reading, with a daily gain of about 0.74%. Despite the small move, BTC has made a major recovery over the past ten days.
The price rose from roughly $62,800 on August 16 to about $78,900 on August 26. That represents an increase of almost 25%, making the move one of Bitcoin’s strongest short-term rallies this year.
The rally has also pushed Bitcoin into an area where sellers have previously shown strength. BTC reached $81,200 but failed to hold above $80,000, leaving the recent breakout attempt unconfirmed.
Market activity has also cooled slightly. Futures volume fell 13.16% to about $62 billion, while open interest declined 0.52% to $55.47 billion. The drop suggests that some traders have reduced their positions after Bitcoin’s rapid climb.
Why $83,000 Could Decide Bitcoin’s Next Move
Bitcoin’s three-day chart gives a more cautious picture than the recent rally might suggest. The chart has continued to show lower highs and lower lows since BTC reached nearly $97,000.

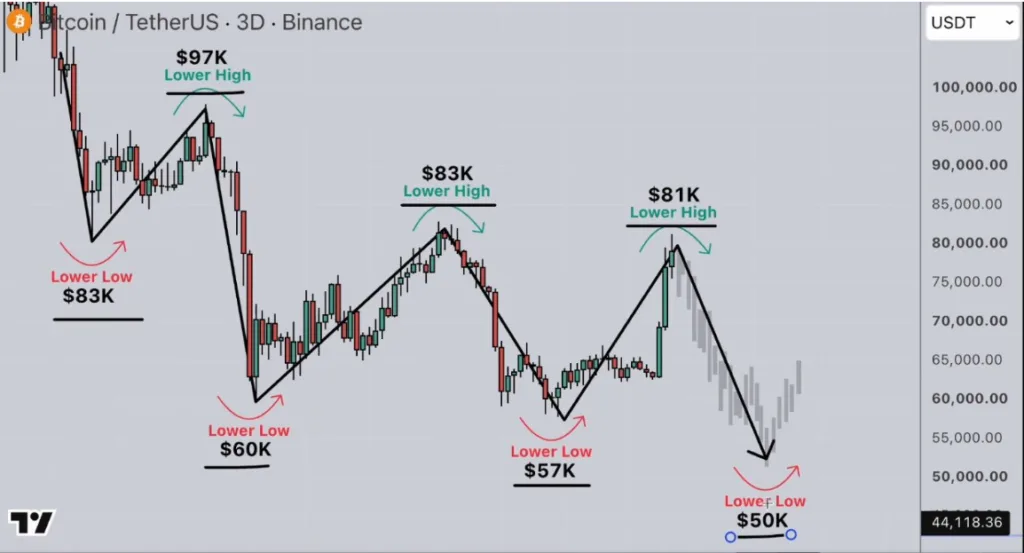
Bitcoin then dropped toward $60,000 before recovering to around $83,000. That recovery was followed by another decline toward $57,000, leaving the current move as another attempt to challenge the same broader resistance structure.
A daily close above $83,000 would therefore carry more weight than a brief move above $81,000. It could signal that buyers are finally breaking the pattern that has kept Bitcoin under pressure.
If BTC continues to fail around $81,000-$83,000, however, sellers could push the price back toward the $78,900-$80,000 support area.
Could Bitcoin Really Fall to $50,000?
The possibility of Bitcoin reaching $50,000 depends on how much support is lost during a correction. A break below $78,900 would be an early warning, but it would not immediately point to $50,000.
Bitcoin would first need to lose the $57,000-$60,000 region. That area has already played an important role in the recent price structure and could attract buyers if BTC moves lower.
If that support fails as well, the bearish case would become much stronger. Some analysts have warned that Bitcoin could revisit $50,000 by November if the current lower-high structure remains intact and bulls fail to reclaim $83,000.
For now, $50,000 is better viewed as a deeper downside scenario. Bitcoin still has several support levels to break before that target becomes a serious near-term possibility.
Bullish Bitcoin Signals Are Returning
The price chart is not the only factor traders are watching. Several on-chain indicators have improved during Bitcoin’s recovery.
CryptoQuant’s Bull Score reportedly jumped from 30 to 80 in one week. Eight of its ten tracked indicators are now showing bullish signals, giving the current rally stronger support from market data.


Spot demand has also recorded its fastest monthly growth since late December. At the same time, spot and futures demand are increasing together for the first time since early October 2025.
CryptoQuant has described the combination as an early-stage bull market setup. However, a confirmed close above the 365-day moving average near $83,000 is still needed to strengthen that view.
Retail Investors Are Still Not Chasing the Rally
One of the more unusual features of the current recovery is the lack of strong retail excitement. Bitcoin has gained almost 25% in ten days, yet sentiment has remained relatively weak.
Weighted sentiment recently turned negative at around -0.023, while the seven-day average stood near +0.009. The strongest reading came on August 19 at +0.054 following Treasury-related news.

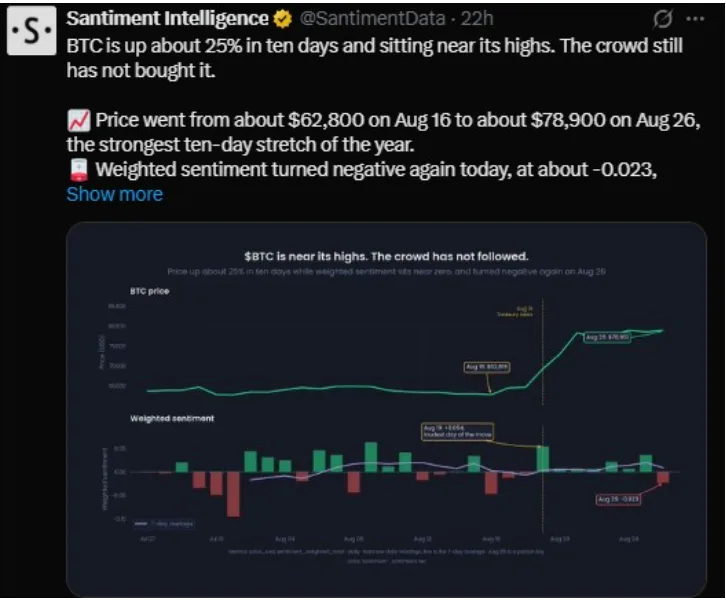
That enthusiasm did not last. Sentiment faded even as Bitcoin continued to trade at much higher levels.
The lack of retail euphoria could be viewed in two ways. It shows that the rally has not attracted a large wave of speculative buying, but it also leaves room for sentiment to improve if Bitcoin breaks above $83,000.
Bitcoin ETFs Continue to Attract Money
Institutional demand is providing a stronger source of support.
US spot Bitcoin ETFs recorded their eighth consecutive day of net inflows, according to SoSoValue data cited in the source report. The funds attracted about $232 million on August 26 alone.
The continued inflows stand out because they have come alongside weak retail sentiment. Institutional buyers have continued adding exposure even while many smaller traders remain cautious.
That demand could help Bitcoin defend its current support if the price experiences another short-term pullback.
Whale Profit-Taking Raises Some Concerns
There are also signs that some large holders are using the recent rally to take profits. Whale wallets reportedly realized a record $614 million in profits on August 20.
Rising exchange inflows for Bitcoin, Ethereum and XRP also suggest that some investors may be preparing to sell after the recent gains.
A wallet linked to US government FTX/Alameda seized funds moved 24.41 BTC, worth about $1.92 million. The transfer itself was not large enough to change the broader market trend, but larger movements from government-linked wallets could create additional selling pressure.
Bitcoin’s unrealized profit margin has also risen to 20.5%, the highest level since June 2025. Higher profit levels can encourage investors to lock in gains, especially when the price is testing major resistance.
Bitcoin Price Prediction: Levels That Matter Now
The immediate battle is between $81,000 and $83,000. Bitcoin needs to clear this area and hold above it to give the recovery a stronger technical foundation.
A successful breakout could weaken the lower-high pattern and improve the chances of another move higher. It would also reduce the immediate risk of a deeper correction toward the $50,000 area.
The opposite scenario begins with a break below $78,900-$80,000. Such a move could shift attention toward $57,000-$60,000, where buyers would need to step in to prevent a much larger decline.
A sustained break below that range would make $50,000 a more realistic target. Until then, the market still has several levels between the current price and that downside zone.
Bitcoin’s Next Move Could Set the Tone
Bitcoin’s recent rally has put the market at an important turning point. The strong rise from $62,800 has improved the broader picture, but the rejection at $81,200 shows that sellers are still defending higher prices.
The bullish case has support from steady ETF inflows, rising spot demand and a much stronger CryptoQuant Bull Score. At the same time, Bitcoin has yet to break the bearish structure on the three-day chart, while whale profit-taking and weak retail sentiment remain concerns.
A close above $83,000 would give bulls their clearest signal yet that the recovery can continue. If Bitcoin instead loses $78,900 and later breaks the $57,000-$60,000 support area, the risk of a move toward $50,000 would increase sharply.
For now, Bitcoin’s next major move will likely depend on whether buyers can finally turn the $81,000-$83,000 resistance zone into support.
ALSO READ: Toncoin Rebrands as Gram as TON Revives Its Original Name
DISCLAIMER:
The views and opinions expressed herein are solely those of the author and do not necessarily reflect the views of the publisher. The publisher does not endorse or guarantee the accuracy of any information presented in this article. Readers are encouraged to conduct further research and consult additional sources before making any decisions based on the content provided.