- Bitcoin faces conflicting signals, with historical patterns suggesting a drop to $60K while support levels hint at a rally toward $140K.
- Traders are divided, making upcoming price movements highly unpredictable.
Bitcoin (BTC) is once again at a critical juncture, leaving traders split over whether the cryptocurrency is poised for a steep decline or a continued bull run. After dropping more than 12% from its recent record above $124,500, BTC is showing patterns that echo previous market cycles, fueling debate over its next move.
Bitcoin Historical Patterns Suggest a Sharp Pullback
Analysts studying Bitcoin’s price action have noted striking similarities between the current market structure and the 2021 bull cycle. Back then, BTC rallied to record highs before suffering a sharp correction that sent it from nearly $69,000 to $32,000 in a matter of weeks.
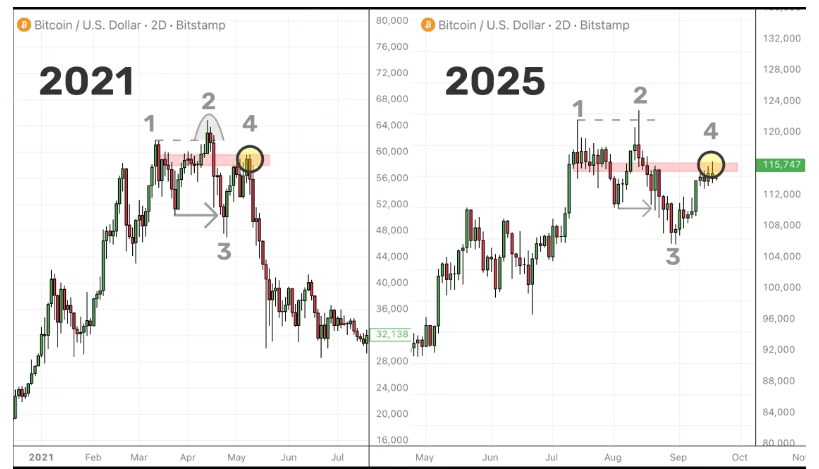
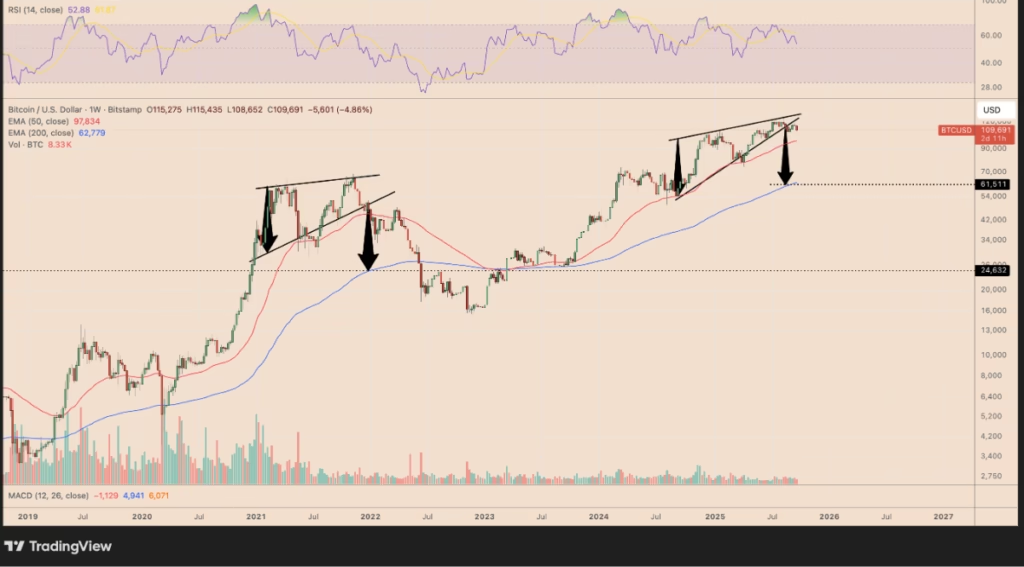
Crypto analyst Reflection warns that BTC is hovering just below a key distribution zone, reminiscent of the 2021 top. Combined with a breakdown from a rising wedge—a bearish formation on the weekly chart—Bitcoin risks a decline to the $60,000–$62,000 range. Some traders even foresee a drop toward $50,000 if the historical fractal repeats.
Bitcoin Support Levels Could Trigger a Mid-Term Recovery
Not all traders are bearish. Many point to Bitcoin’s 200-day moving averages as a strong support cluster. Currently near $104,000–$106,000, this level could act as a mid-term bottom, preventing a larger sell-off.
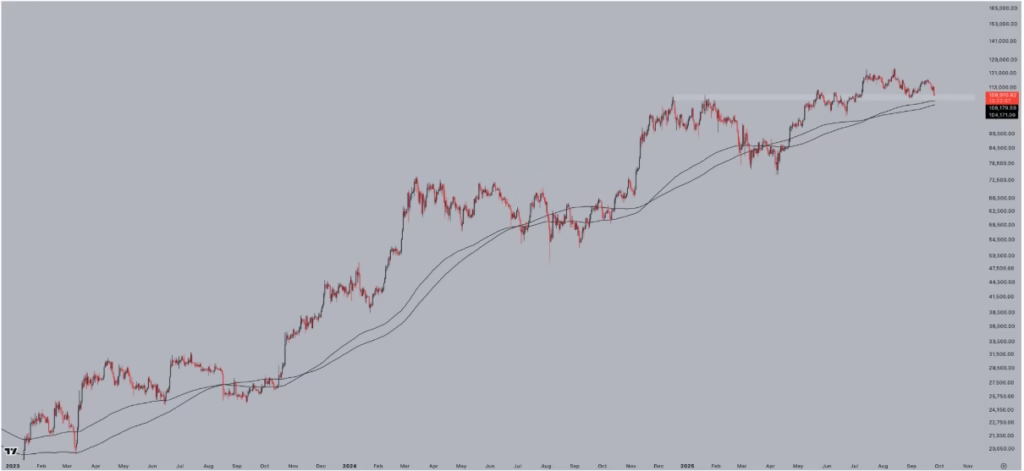
Analyst Bitbull highlights that the US business cycle has not peaked, suggesting the broader economic momentum may still favor Bitcoin. Meanwhile, interest rate cuts by the Federal Reserve could provide additional support for another phase of price growth.
Bullish Signals Hint at a Potential $140K Rally
Despite recent dips, several analysts maintain that Bitcoin remains on track for higher highs. Captain Faibik identifies the formation of a potential bull flag, arguing that a decisive move above $113,000 could spark a rally toward $140,000.
Even more optimistic forecasts suggest BTC could reach $150,000–$200,000 by the end of the year if bullish conditions persist, driven by a combination of macroeconomic trends and renewed investor interest.
The Takeaway
Bitcoin’s path in the coming months hinges on critical support and resistance zones. Traders should watch the $104,000 moving average for stability and the $113,000 resistance for potential breakout confirmation. Whether BTC retests $60,000 or rallies past $140,000 will likely define the next major chapter in this bull market.
DISCLAIMER:
The views and opinions expressed herein are solely those of the author and do not necessarily reflect the views of the publisher. The publisher does not endorse or guarantee the accuracy of any information presented in this article. Readers are encouraged to conduct further research and consult additional sources before making any decisions based on the content provided.
About the Author