- Bitcoin is testing key resistance after a 6% rally, with a possible breakout toward $81K or rejection.
- ETF outflows and resistance levels leave BTC at a critical turning point.
Bitcoin is gaining strength after a sharp short-term rally, but the market is approaching a critical resistance zone that could decide the next major move. BTC is currently trading around the $73,000–$74,000 range after rising roughly 5–6% in recent sessions. While the recovery looks steady, analysts warn that this is often where false breakouts occur.
The price is now testing an important technical structure that could either confirm a breakout toward higher levels or trigger another rejection.
Bitcoin Approaches Key Double Bottom Breakout Level
Bitcoin is attempting to break above the neckline of a developing double bottom pattern near $72,810. This level is now acting as the main short-term trigger zone.
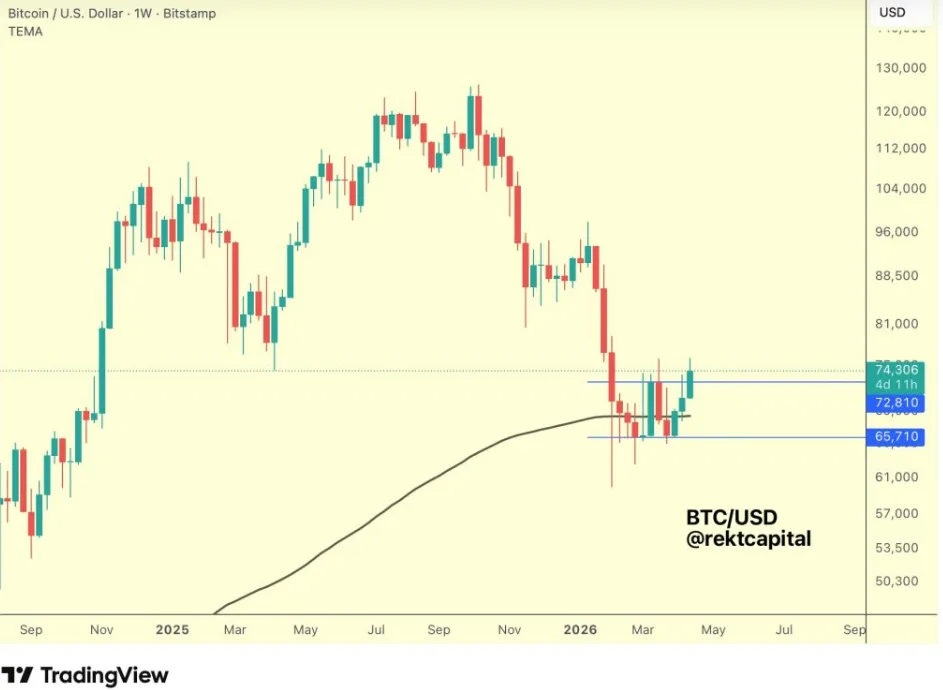
A weekly close above this point would strengthen the bullish outlook. A successful retest at the same support level would further confirm the breakout structure. If both conditions are met, BTC could move toward the $81,000 to $82,500 range.
However, analysts note that similar setups in past cycles have often looked strong before failing to sustain upward movement.
What Confirms a Real Breakout for BTC
Market analysts highlight two main confirmation signals that traders are watching closely.
A weekly close above $72,810 would be the first strong confirmation of strength. The second would be a successful retest, with the price holding above this level before continuing upward.
Without these signals, the breakout remains uncertain and vulnerable to reversal.
Several risks remain in play:
- Price rejection at $72,810 resistance
- A false breakout followed by a sharp drop
- Weak continuation after breakout with failure to reach targets
100-Day Moving Average Adds Pressure
Bitcoin is also testing its 100-day simple moving average, a level that has acted as strong resistance in previous market phases. In past cases, rejection from this zone has led to corrections of up to 40%.
If BTC is rejected again, it could form a triple top pattern. That would increase the risk of a pullback toward the $59,800 area.
On the other hand, a clean break above the 100-day moving average would strengthen the bullish structure and suggest that the broader correction phase may be ending.
ETF Outflows Signal Market Caution
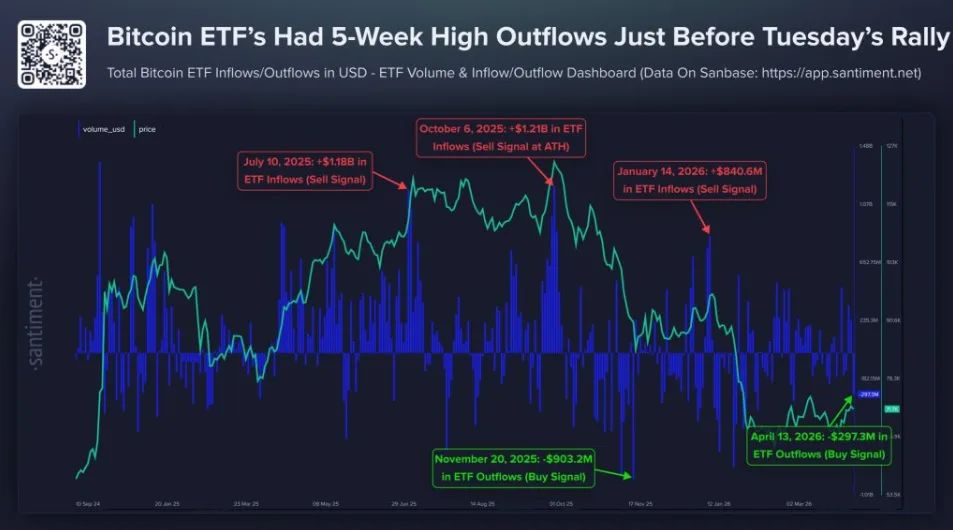
Recent market data shows nearly $297 million in Bitcoin ETF outflows. This reflects rising caution among retail investors.
Historically, heavy outflows have often appeared near local lows rather than market tops. At the same time, strong inflows have frequently aligned with peak optimism.
This mixed signal adds uncertainty to the current setup.
BTC Price Outlook Remains at a Turning Point
Bitcoin is now at a decisive technical stage. The market can still extend gains toward $80,000 and beyond if resistance levels are cleared.
However, failure to confirm the breakout could lead to another rejection phase and renewed downside pressure.
Traders are now watching closely to see whether BTC confirms strength or slips back into a broader consolidation range.
ALSO READ: Ripple Joins Forces With Kyobo to Launch South Korea’s First Tokenized Bond Settlement System
DISCLAIMER:
The views and opinions expressed herein are solely those of the author and do not necessarily reflect the views of the publisher. The publisher does not endorse or guarantee the accuracy of any information presented in this article. Readers are encouraged to conduct further research and consult additional sources before making any decisions based on the content provided.
About the Author