- Bitcoin is consolidating above $70,000 after its recent rally, with traders watching resistance near $72,500.
- A breakout or breakdown could determine the market’s next direction.
Bitcoin’s recent rally appears to be slowing after pushing above key resistance levels. The cryptocurrency is now consolidating, leaving traders watching closely for the next directional move.
Bitcoin Rally Meets Resistance Near $74,000
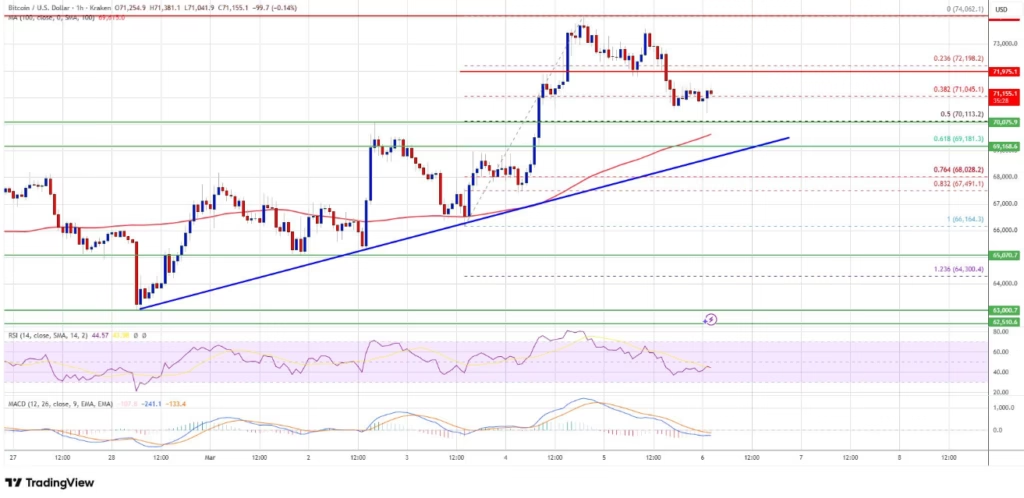
Bitcoin began a strong upward move after stabilizing above the $70,000 level. The rally gathered pace as the price broke through the $72,000 resistance zone, signaling strong buying interest in the market. Eventually, Bitcoin reached a local high of around $74,062 before sellers stepped in.
Following that peak, the market experienced a mild pullback. The price slipped below $72,000 and retraced part of the earlier upward move. Despite the correction, Bitcoin continues to trade above the $70,000 level and remains above the 100-hourly simple moving average, which is often considered a sign that the broader trend remains intact.
Market analysts also note the formation of a bullish trend line on the hourly BTC/USD chart, with support positioned near $69,000. This trend line could play a critical role in determining whether buyers maintain control.
Key Resistance Levels Traders Are Watching
For the bullish scenario to continue, Bitcoin needs to reclaim higher resistance zones. The immediate hurdle sits near $72,000, while the first major resistance level is positioned around $72,500.
A strong close above $72,500 could open the door for another upward push. In that scenario, the price may test the $73,200 level and possibly revisit the $74,000 region where the previous rally stalled. If buying pressure strengthens further, additional resistance could appear near $75,000 and $75,500.
Such a move would signal renewed confidence among traders and could trigger another phase of upward price movement.
Downside Risks if Support Levels Break
While the market structure still favors buyers, there is also a possibility of another correction if Bitcoin fails to clear the $72,000 resistance.
The first support level to watch is around $70,000, which aligns with a key Fibonacci retracement level from the recent rally. A break below this level could push the price toward the $69,000 support zone, which also coincides with the bullish trend line.
If selling pressure increases, the next support levels could appear near $68,500 and $68,000. The most critical support area currently sits around $66,200. A drop below this level could weaken the short-term outlook and make recovery more difficult.
Technical indicators suggest that buying pressure may be cooling slightly. The hourly Relative Strength Index has slipped below the 50 level, while the MACD indicator is beginning to lose strength in the bullish zone.
For now, Bitcoin remains in a consolidation phase, with traders closely watching whether the next move will bring a fresh breakout or a deeper correction.
ALSO READ:The Rise of Bitcoin ETFs and Their Market Impact
DISCLAIMER:
The views and opinions expressed herein are solely those of the author and do not necessarily reflect the views of the publisher. The publisher does not endorse or guarantee the accuracy of any information presented in this article. Readers are encouraged to conduct further research and consult additional sources before making any decisions based on the content provided.
About the Author