- Bitcoin fell below $67,000 as $173 million flowed out of US-listed Bitcoin ETFs and geopolitical tensions weighed on investor risk appetite.
- The market remains in a broad $60,000–$70,000 sideways range, with support near $65,900 and resistance around $72,600.
Bitcoin (BTC) has fallen below $67,000, wiping out most of the recovery seen earlier this week. Market volatility is fueled by large ETF outflows and geopolitical tensions, leaving investors cautious about riskier assets.
ETF Outflows Weigh on Institutional Demand
US-listed spot Bitcoin ETFs recorded an outflow of $173.73 million on Wednesday, reversing two days of inflows. This sudden shift signals hesitation among institutional investors, who remain cautious amid ongoing market uncertainty.
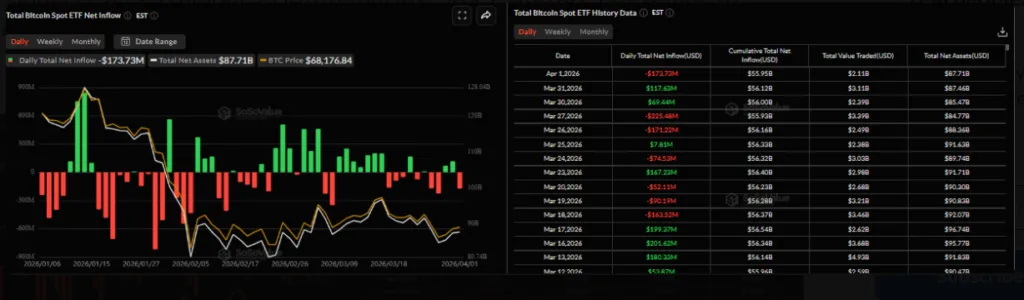
The indecision highlights that despite Bitcoin’s high price range, institutional investors are reluctant to increase exposure while risk factors remain elevated.
Geopolitical Tensions Shake Risk Appetite
Investor confidence took a hit after former US President Donald Trump warned that the ongoing war could escalate, threatening to target Iranian power plants. Such remarks pushed the US Dollar and oil prices higher while dampening appetite for equities and cryptocurrencies.
The heightened geopolitical risk adds to Bitcoin’s short-term volatility, making the market sensitive to global events.
Bitcoin Remains in a Broad Sideways Trend
Despite these pressures, Bitcoin continues trading within the $60,000–$70,000 range. Glassnode reports indicate early signs of stabilization, with supply in loss still elevated and long-term holder capitulation not fully resolved.
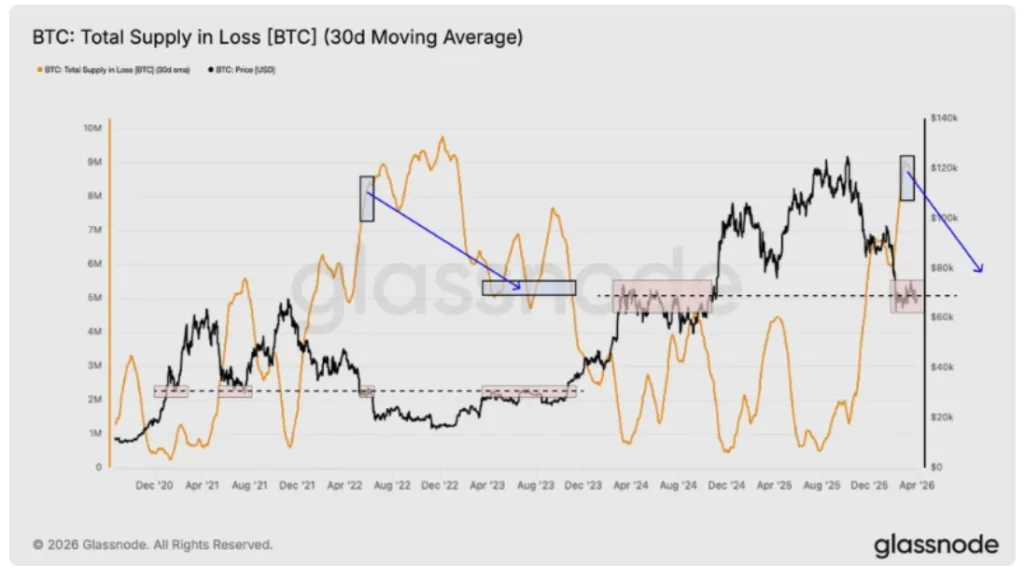
Analysts note that while the market is no longer under extreme stress, it remains in a redistribution phase, lacking strong conviction to move decisively in either direction.
Key Levels to Watch in the Coming Days
Bitcoin’s immediate support lies near $65,900, with a break below exposing the psychological $60,000 level. On the upside, resistance sits around $69,200 and the channel top near $72,600, where the 50-day EMA also forms a key barrier.
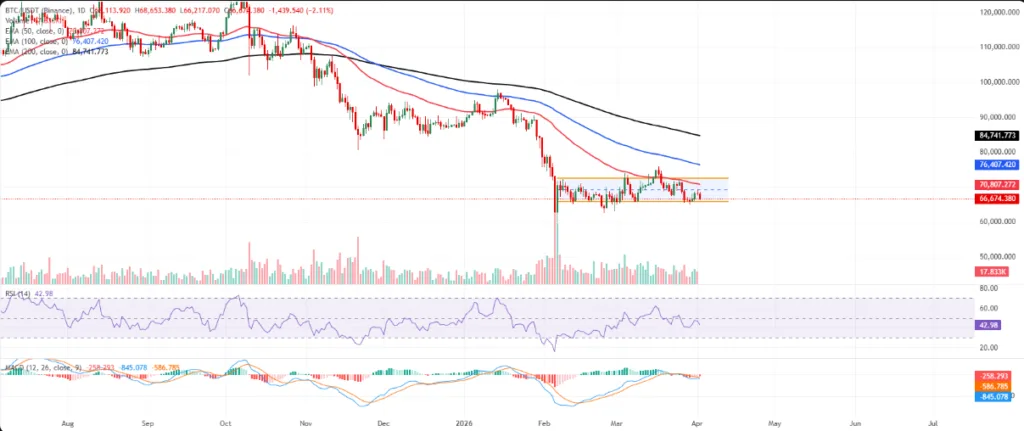
Technical indicators show weak momentum: the RSI is in the low 40s, and the MACD remains below the signal line with a negative histogram, pointing to ongoing selling pressure.
ALSO READ: Pi Network Set for Major Upgrade With Cross-Chain Bridge and Smart Contracts Launch
DISCLAIMER:
The views and opinions expressed herein are solely those of the author and do not necessarily reflect the views of the publisher. The publisher does not endorse or guarantee the accuracy of any information presented in this article. Readers are encouraged to conduct further research and consult additional sources before making any decisions based on the content provided.
About the Author