- Bitcoin falls toward $83K as higher oil prices, Treasury yields and a stronger dollar pressure BTC.
- ETF inflows remain strong but have slowed.
Bitcoin price slipped toward $83,000 on Sept. 28 after failing to hold above $87,000. The decline comes even as US spot Bitcoin ETFs continue to attract billions of dollars in fresh capital.
Higher oil prices, rising Treasury yields and a stronger US dollar are adding pressure to BTC. At the same time, ETF inflows have slowed from the strong pace seen earlier in the week.
Bitcoin Price Struggles Below $87,000
Bitcoin traded near $83,340 during the Asian session on Sept. 28, down about 1.2% over the previous 24 hours.
BTC had climbed above $87,000 earlier in the week. However, sellers pushed the price back below $86,000 before the decline extended toward the $83,000 area.
Bitcoin has since remained largely within the $83,000 to $85,000 range. The latest move puts the cryptocurrency close to an important support level.
The broader market is also facing pressure from changes in global macro conditions.
Oil Prices and Treasury Yields Add Pressure
Oil prices moved higher after tensions between the US and Iran increased over the weekend.
Brent crude rose about 1.5% to 1.6%, moving toward $106 per barrel. Higher energy prices have renewed concerns about inflation because rising fuel costs can increase transportation and production expenses.
The Strait of Hormuz is especially important to global energy markets. Around 20% of global oil supply passes through the waterway.
US Treasury yields have also remained elevated. The 10-year Treasury yield was around 5.2%, while the 30-year yield was near 5.52%.
Higher bond yields can make riskier assets less attractive by increasing the return available from government debt. They can also tighten financial conditions across markets.
The US dollar has strengthened at the same time. The dollar index was around 101.15 and was heading toward a roughly 1.7% monthly gain.
These factors have created a tougher backdrop for Bitcoin.
Bitcoin ETF Inflows Remain Strong, but Momentum Is Slowing
Bitcoin’s decline is notable because US spot Bitcoin ETFs are still attracting substantial inflows. The funds recorded about $2.39 billion in net inflows during the five trading sessions through Sept. 25, according to SoSoValue data.
Monday saw the largest inflow at $999 million. That was followed by $714.7 million on Tuesday, $347 million on Wednesday, $190.6 million on Thursday and $134.5 million on Friday.
The positive streak reached seven consecutive trading sessions, bringing total inflows during that period close to $3 billion.
However, the daily numbers show a clear slowdown. Inflows fell in every session after Monday’s $999 million figure. This suggests ETF demand is still providing support, but the buying pressure has weakened as Bitcoin moves lower.
That helps explain why strong ETF inflows have not been enough to push BTC back above $87,000.
Leveraged Selling Adds to Bitcoin’s Decline
Bitcoin’s drop below $84,000 triggered a wave of liquidations among leveraged traders, adding to the selling pressure as the price moved lower.
Derivatives data showed several long positions being liquidated between $83,200 and $83,500. One Hyperliquid position worth about $844,000 was liquidated at around $83,479.
The liquidations were relatively small compared with the much larger events seen during previous sharp Bitcoin selloffs. Even so, forced selling can accelerate a decline when traders are already watching key support levels.
Bitcoin Price Tests $82,873 Support
Bitcoin’s technical setup has weakened as the price has pulled back from $87,000. On the daily chart, BTC remains above the breakout area formed earlier in September. However, buying momentum has slowed.
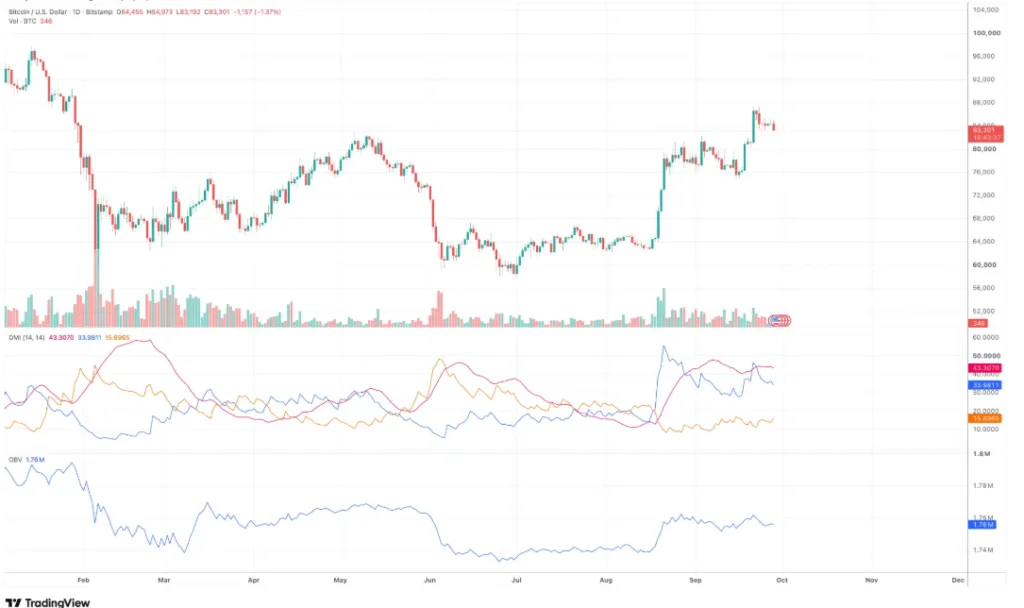
The Directional Movement Index still favors the positive side. The +DI stands at 33.98 compared with 15.90 for -DI, while the Average Directional Index is at 43.31.
An ADX above 25 generally indicates a strong directional trend. The current readings therefore suggest that the broader daily trend has not yet turned bearish.
However, the decline in +DI is worth watching. A further fall in +DI combined with a rise in -DI would show that sellers are gaining more control.
On Balance Volume has also flattened after rising during Bitcoin’s September breakout. The indicator has declined from its recent high, suggesting trading volume is not confirming another move toward $87,000.
$82,873 Becomes the Key Level
The 4-hour chart shows $82,873 as the immediate support level.
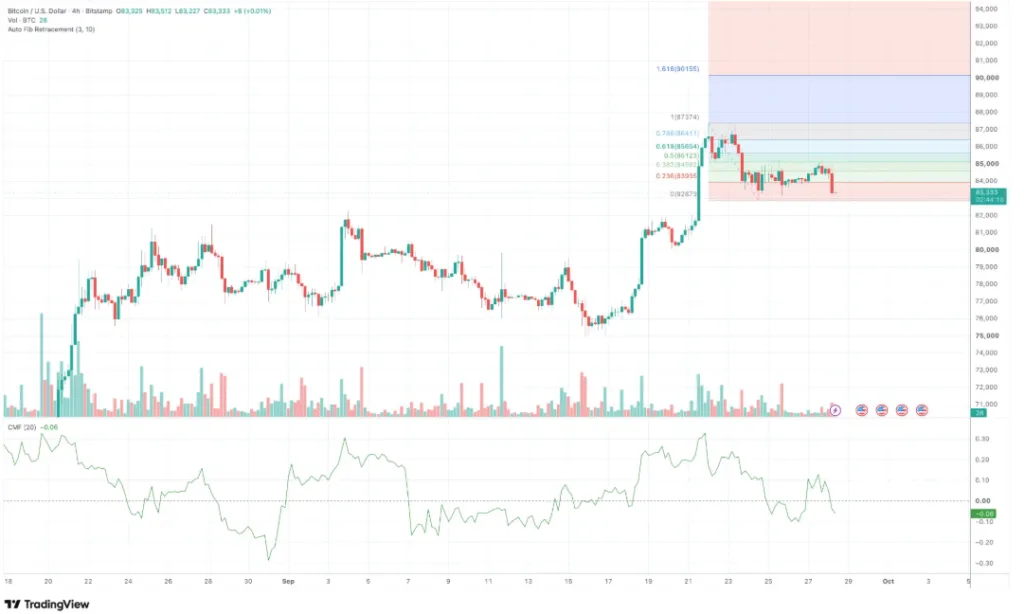
Bitcoin is trading only slightly above that level after falling below the 23.6% Fibonacci retracement at $83,935.
Chaikin Money Flow has also fallen to around -0.06. The indicator moved below zero during the latest selloff, showing that selling pressure has outweighed buying pressure over the measured period.
A 4-hour close below $82,873 could expose Bitcoin to further losses. The next support area would be around $81,000 to $82,000. Below that, the previous breakout region near $80,000 could become important.
Bitcoin Needs to Reclaim $83,935
For the short-term structure to improve, Bitcoin first needs to recover $83,935. A move above that level would put $84,591, the 38.2% Fibonacci retracement, back in focus. The next resistance levels are around $85,123 and $85,654.
Above $85,654, Bitcoin could retest $86,411 before the recent swing high near $87,374.
For now, BTC remains caught between continued ETF demand and a weaker short-term market backdrop. The reaction around $82,873 could provide a clearer indication of whether the current pullback remains contained or develops into a deeper correction.
ALSO READ: VeChain Price Drops 9% After Interstellar Upgrade as VET Tests $0.008674 Support
DISCLAIMER:
This article reflects the author’s views and is provided for informational purposes only. While we strive for accuracy, the publisher does not guarantee that all information is complete or current. Readers should verify important information and consult appropriate sources before making decisions based on this content.
About the Author