
- Cardano is under pressure after rejection at key resistance, with price slipping below $0.240 as bearish Strength builds.
- On-chain and technical data both suggest early holders are selling, and a deeper correction may follow.
Cardano is trading in the red after facing rejection at a key resistance zone earlier this week. The price has dropped below $0.240 and is down nearly 4% in a single session.
The recent move shows growing weakness in the short-term structure. ADA failed to break above a key barrier near $0.245, which triggered renewed selling pressure. The market now shows a clear bearish bias as sellers stay in control.
On-chain signals point to early holders selling
On-chain data suggests increased risk for further downside. Activity from dormant wallets has risen, showing that long-held tokens are moving again. This often signals distribution from early investors.
At the same time, the Network Realized Profit/Loss indicator has dropped sharply. This suggests that many holders are currently selling at a loss rather than a profit. Data from Santiment highlights this shift in behavior.
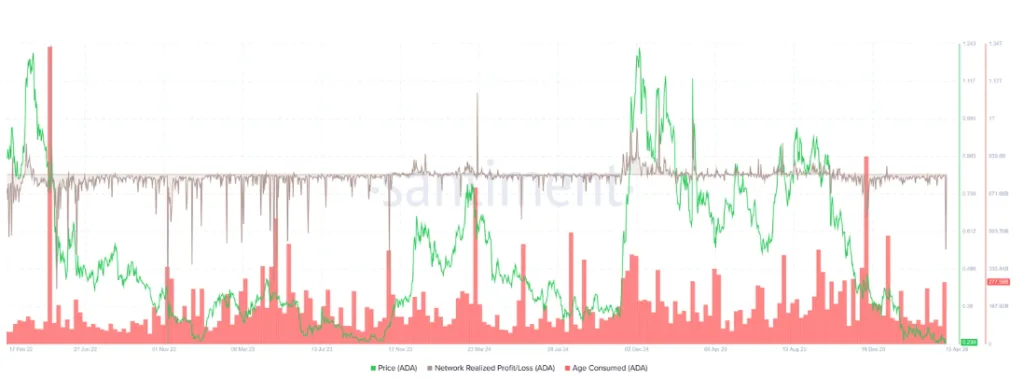
Historically, this combination of rising dormant wallet activity and negative profit realization has often come before stronger sell-offs in Cardano.
A similar pattern was seen in early December. That period was followed by a sharp price decline, reinforcing concerns about a repeat move under current conditions.
Derivatives market confirms bearish sentiment
Market positioning also reflects weakness. The long-to-short ratio from Coinglass sits below 1 at 0.95. This shows that more traders are betting on downside movement than upside.
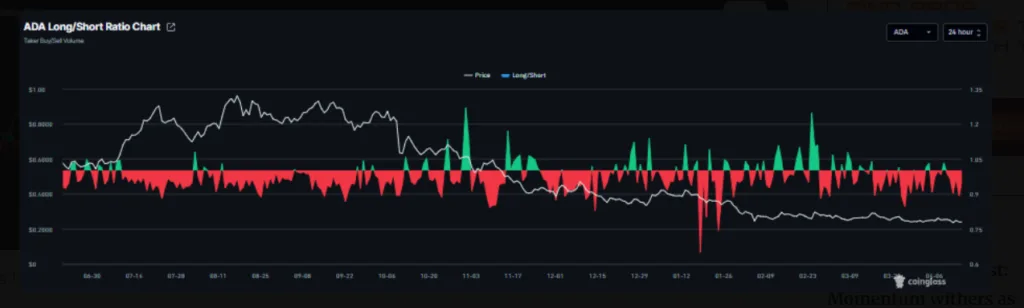
This bearish positioning has remained in place since mid-March. It signals persistent caution across the derivatives market.
When combined with on-chain data, the outlook becomes more fragile. Both investors and traders appear to be leaning toward further downside risk for Cardano.
Technical outlook shows pressure below major moving averages
Price action remains weak on the technical side. ADA is trading below the 50-day, 100-day, and 200-day exponential moving averages. This confirms that sellers still dominate the trend.
The nearest resistance sits at $0.245. Above that, the next barriers are $0.262 and $0.271. These levels align with the 50-day EMA and a key Fibonacci retracement zone.
Further resistance appears near $0.299 and $0.303, where multiple technical levels cluster. Higher up, $0.328 and $0.354 mark additional rejection zones. The strongest long-term resistance sits near $0.400, aligned with the 200-day moving average.
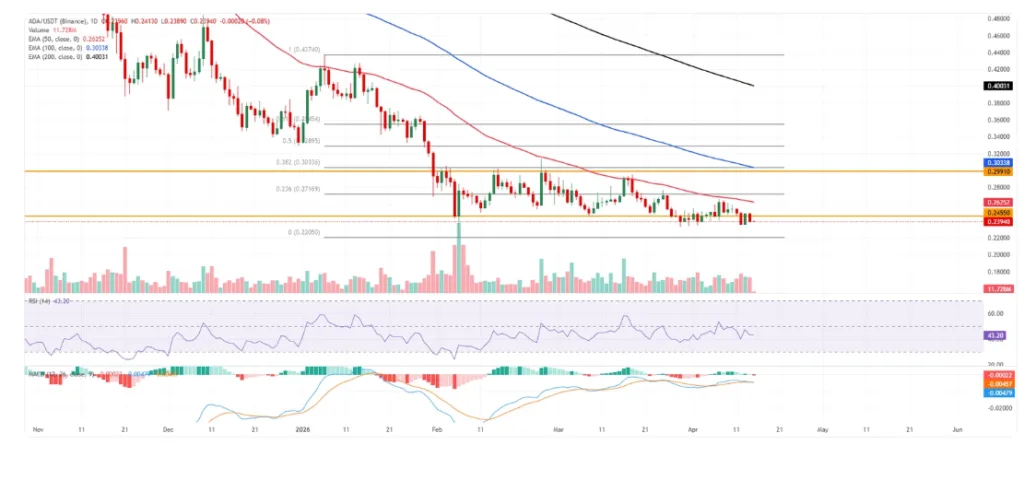
On the downside, support is limited. The main level to watch is $0.220. A break below this zone could expose a deeper correction phase.
Indicators show weak recovery potential in the short term
Technical indicators also support the bearish outlook. The Relative Strength Index is near 43, which shows weak buying pressure. It remains below the neutral 50 level, suggesting sellers still have control.
The Moving Average Convergence Divergence indicator also shows a negative reading. This reflects weak recovery strength and limited upside follow-through.
Together, these signals suggest that any short-term bounce may face strong selling pressure. The broader structure still favors downside continuation unless ADA reclaims key resistance zones.
Outlook for Cardano price action
The current setup places Cardano in a vulnerable position. Weak on-chain activity, bearish derivatives positioning, and resistance-heavy technical structure all point to continued pressure.
A recovery above $0.245 would be the first sign of relief. However, failure to hold current levels could open the door toward $0.220 support and potentially lower levels if selling accelerates.
For now, the market remains cautious. Both data and price action suggest that risks are tilted toward a deeper correction in the near term.
ALSO READ: Pi Network Price Slips as Consensus Miami 2026 Appearance Builds Hype
DISCLAIMER:
The views and opinions expressed herein are solely those of the author and do not necessarily reflect the views of the publisher. The publisher does not endorse or guarantee the accuracy of any information presented in this article. Readers are encouraged to conduct further research and consult additional sources before making any decisions based on the content provided.
About the Author