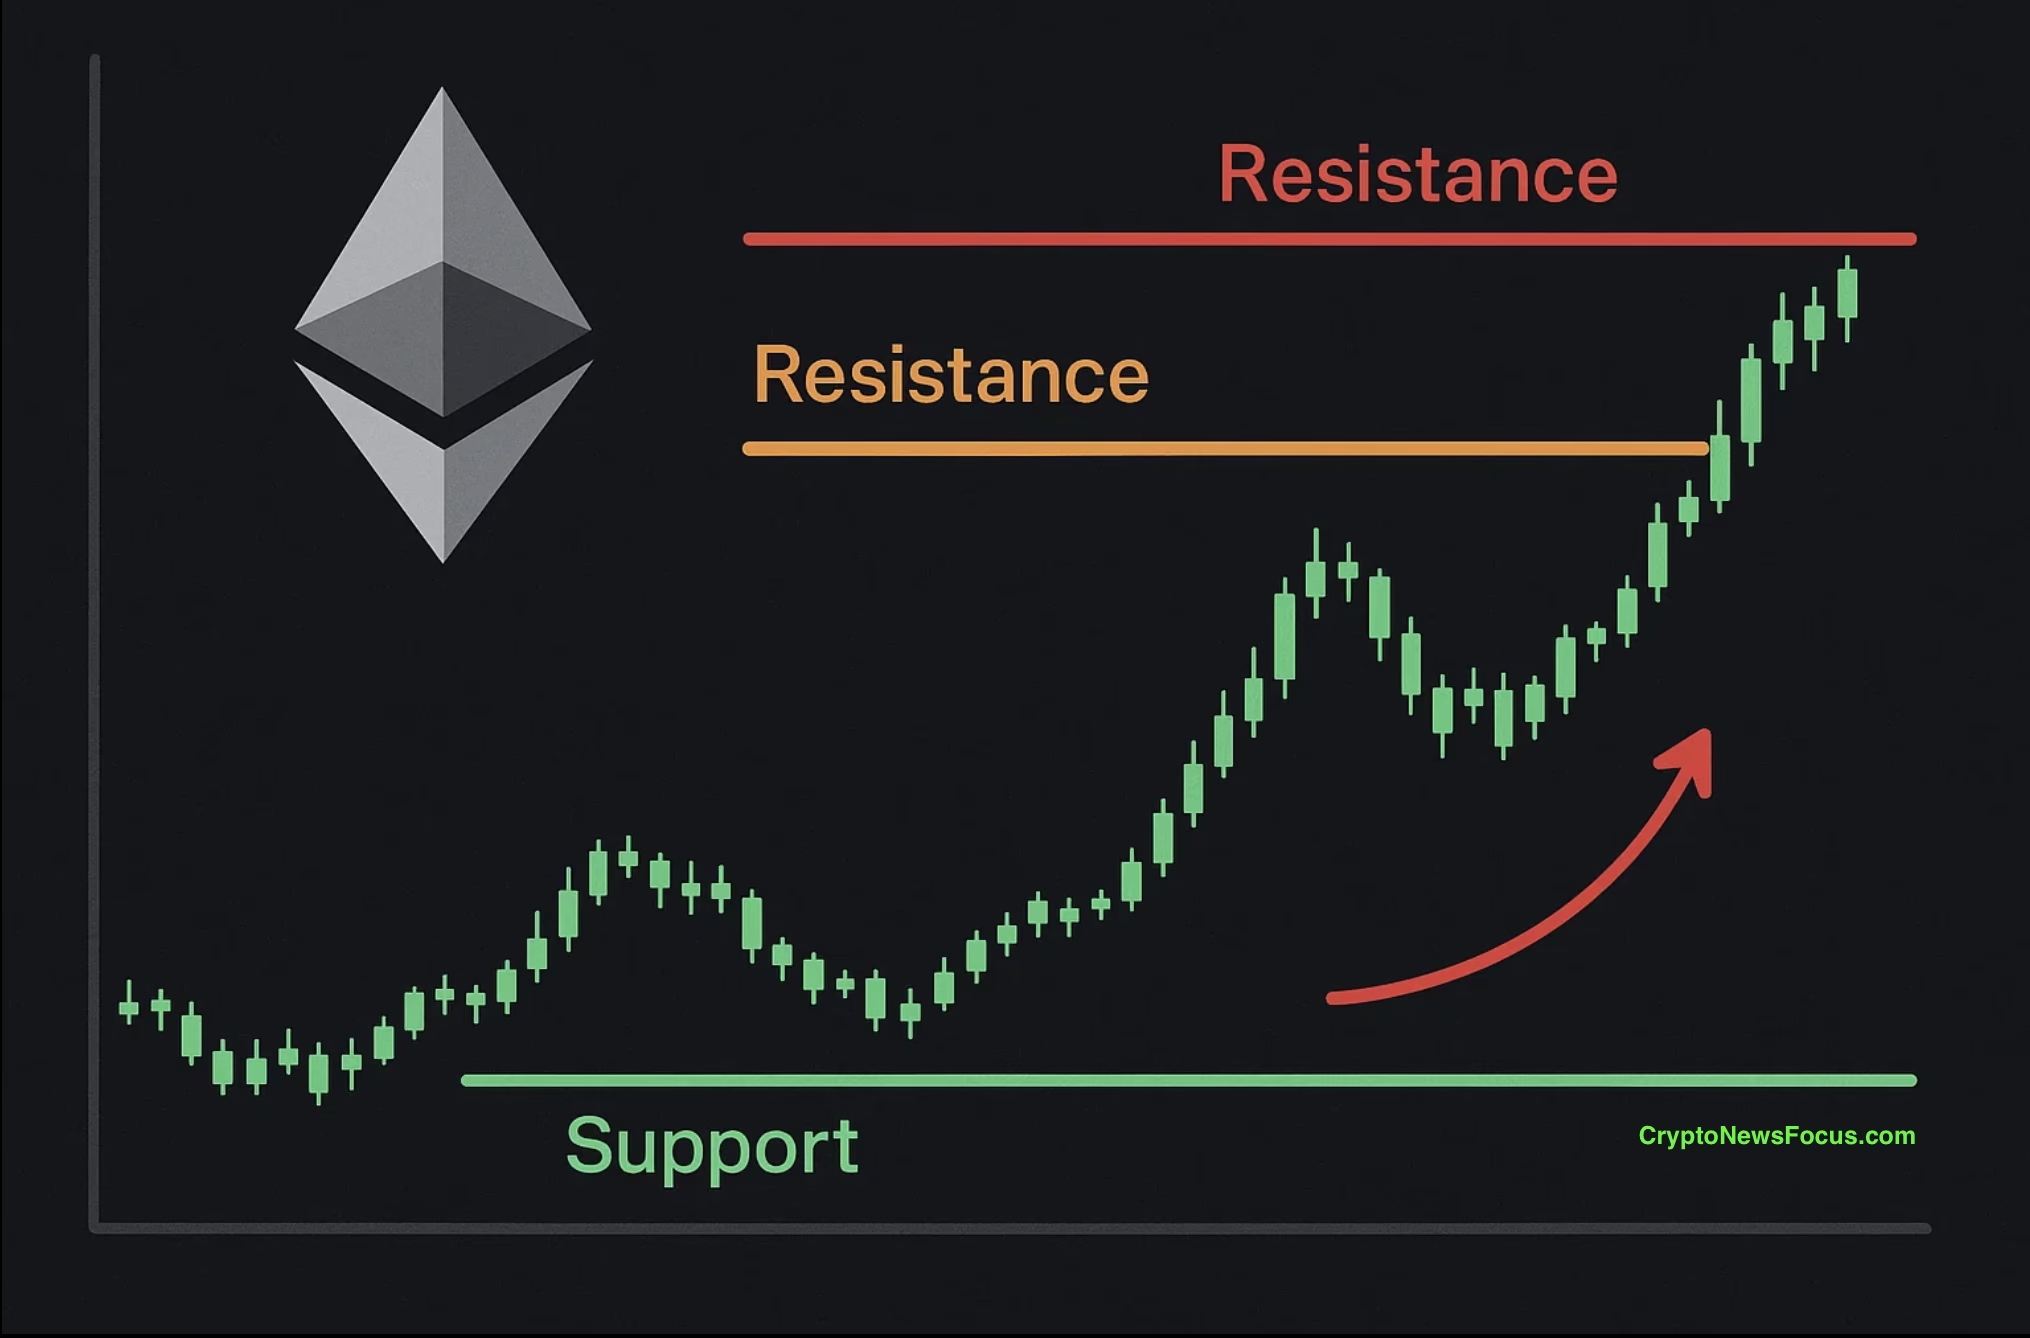
- Ethereum is consolidating above $1,920 after rebounding from recent lows, but remains capped below the key $2,000 resistance.
- A breakout above this level could open further gains, while failure may trigger another short-term decline.
Ethereum continues to trade in a tight range after failing to reclaim the psychological $2,000 level. The recent pullback mirrors broader market hesitation, with buyers stepping in near key support but lacking enough strength to force a decisive breakout. As price action compresses, traders are watching closely for clues on whether ETH can recover or slide into another short-term decline.
After dropping from recent highs, ETH found demand around the $1,922 area. That level attracted buyers and sparked a modest rebound, pushing the price back above $1,950. Still, the recovery has stalled below important resistance zones, leaving the market in a state of consolidation.
Price Recovery Meets Strong Resistance
Ethereum’s rebound carried it past the 38.2% Fibonacci retracement of the move from $2,038 to $1,922. Despite that progress, ETH remains capped below $1,985 and the 100-hour Simple Moving Average. A descending trend line on the hourly chart adds extra pressure near $2,000, reinforcing that zone as a major hurdle.
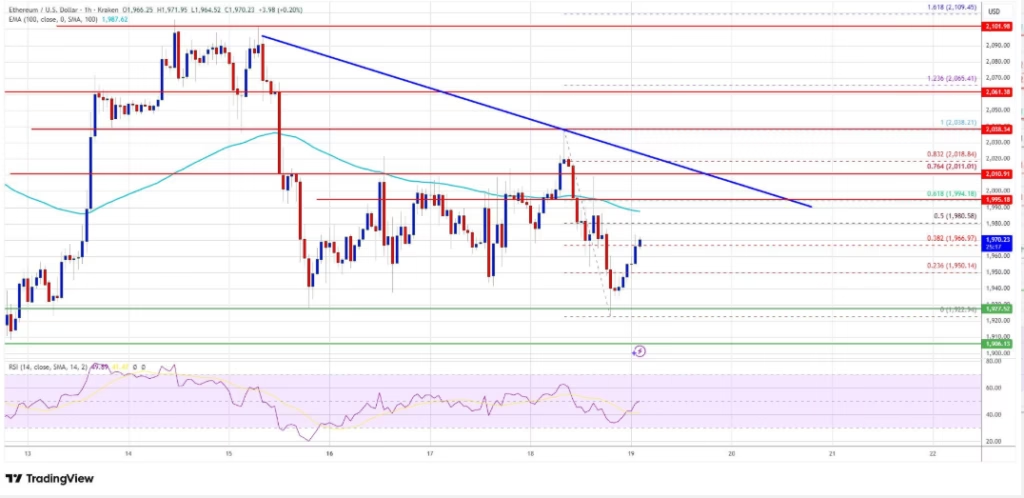
If buyers can defend the $1,925 region, another attempt toward $1,980 and $2,000 remains possible. A clean break above $2,020 would improve the short-term outlook, potentially opening the door for a move toward $2,050. Beyond that, stronger gains could push ETH toward the $2,120 or even $2,150 area.
Downside Risks Remain if $2,000 Holds
Failure to clear $2,000 could trigger renewed selling pressure. Initial downside support sits near $1,935, followed by the more critical $1,925 level. A decisive move below that area may expose ETH to a deeper pullback toward $1,880.
Further weakness could extend losses to $1,840, with the main support resting near $1,820. These levels are likely to attract buyer interest, but a break below them would signal growing bearish control in the short term.
Technical Indicators Signal Indecision
From a technical perspective, indicators reflect uncertainty. The hourly MACD remains positive but shows fading bullish strength. Meanwhile, the Relative Strength Index hovers near the neutral 50 mark, suggesting neither buyers nor sellers have clear dominance.
For now, ETH sits at a crossroads. Holding above $1,920 keeps recovery hopes alive, while continued rejection near $2,000 may tilt the balance toward another decline. The next decisive move will likely depend on whether bulls can finally overcome resistance or if sellers regain control near current levels.
ALSO READ: BlackRock Launches Staked Ethereum ETF With $100,000 Seed Capital
DISCLAIMER:
The views and opinions expressed herein are solely those of the author and do not necessarily reflect the views of the publisher. The publisher does not endorse or guarantee the accuracy of any information presented in this article. Readers are encouraged to conduct further research and consult additional sources before making any decisions based on the content provided.
About the Author