


- Ethereum price is showing strength as whale accumulation, exchange outflows, and improving ETH/BTC performance support the bullish outlook.
- Tom Lee and Arthur Hayes believe ETH could reach $5,000 if it breaks key resistance levels.
Ethereum price is showing signs of strength after a recent rally pushed ETH toward $2,444. Traders are now watching whether the rally can continue toward $3,000 and eventually $5,000.
Bullish signals are appearing across technical and on-chain data. Whale accumulation, exchange outflows, and a stronger ETH/BTC ratio are adding to the positive outlook.
Tom Lee and Arthur Hayes have also backed a potential move toward $5,000. However, Ethereum still needs to clear several important resistance levels first.
Ethereum Price Faces Key Resistance
Ethereum traded near $2,444, gaining about 2.7% over the past 24 hours. Futures volume reached $48.94 billion, while spot trading volume stood at around $3.43 billion.
Open interest also climbed to about $31.84 billion. Options volume reached $1.36 billion, with options open interest at $7.08 billion. Ethereum has a circulating and total supply of about 120.68 million ETH. Its market capitalization stands near $296.16 billion.
The next major resistance sits between $2,722 and $2,970. URPD data shows that around 16.70 million ETH were acquired within this range. This could make the zone a major barrier for ETH. Some holders may sell when the price returns to their previous buying levels.
A clear break above $2,970 could strengthen the bullish outlook. The next MVRV pricing band points toward $5,363 based on the 2.4 MVRV level. However, a rejection could push ETH back toward its realized price near $2,235.
Why Is Ethereum Price Rising?
Ethereum’s recent rally followed a bullish shift in its MVRV ratio. On August 19, the ratio moved above its 160-day moving average, according to Ali.

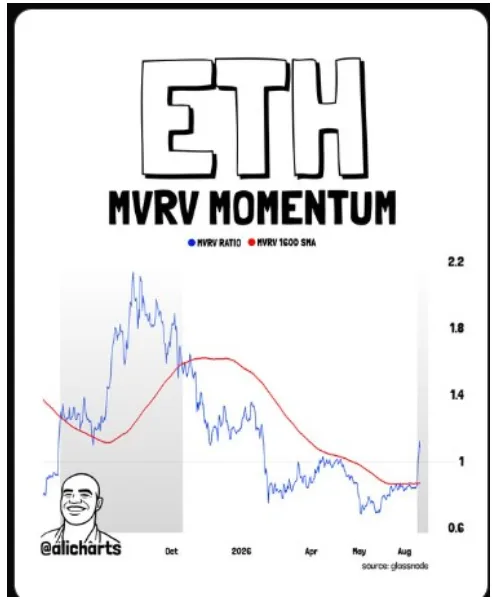
This crossover is often viewed as a sign of improving market conditions. It also came as ETH started recovering from its earlier lows.
Since the crossover, Ethereum has gained about 34%. ETH climbed from around $1,905 to a recent high of $2,547.
The strong recovery has renewed interest in Ethereum among traders. Many are now watching whether the rally can continue toward the $3,000 level and beyond.
Ethereum Whales Continue to Accumulate
Whale activity is also supporting the bullish Ethereum price outlook.
Wallets holding more than 10,000 ETH increased by 1.74% over the past week. The data also shows 17 new whale wallets joining this group.
Ethereum is also leaving exchanges at a steady rate. More than 180,764 ETH, worth nearly $440 million, was withdrawn from exchange wallets during the same period.
Large exchange outflows can suggest that holders are moving ETH into long-term storage. This could reduce selling pressure if fewer coins remain available on exchanges.
Can Ethereum Reach $3,000?
The $2,722 to $2,970 range remains the most important resistance zone for Ethereum in the near term. This area could determine whether ETH can extend its recent recovery or face another pullback.
A weekly close above $2,450 would be an encouraging sign for buyers. It could increase the chances of Ethereum moving toward the $3,000 level before facing stronger selling pressure.
However, ETH still needs to push through the heavy supply zone above $2,700. URPD data shows that a large amount of ETH was bought in this range, which could lead some holders to sell once the price reaches their entry levels.
If Ethereum breaks above $2,970 and holds the level, the bullish setup would become stronger. A sustained move higher could then put the next major MVRV pricing level near $5,363 in focus.
Arthur Hayes Sees a Path Toward $5,000
Arthur Hayes has added to the bullish Ethereum outlook.
Hayes recently described ETH as one of the more disliked large-cap altcoins in the market. He noted that Ethereum remains below its 2021 all-time high despite the wider crypto market advancing. ETH is also Hayes’ largest Maelstrom holding outside Bitcoin.
He believes Ethereum has room to catch up after lagging other major assets during this cycle. Hayes suggested that a move above $3,000 could open the path toward $5,000.
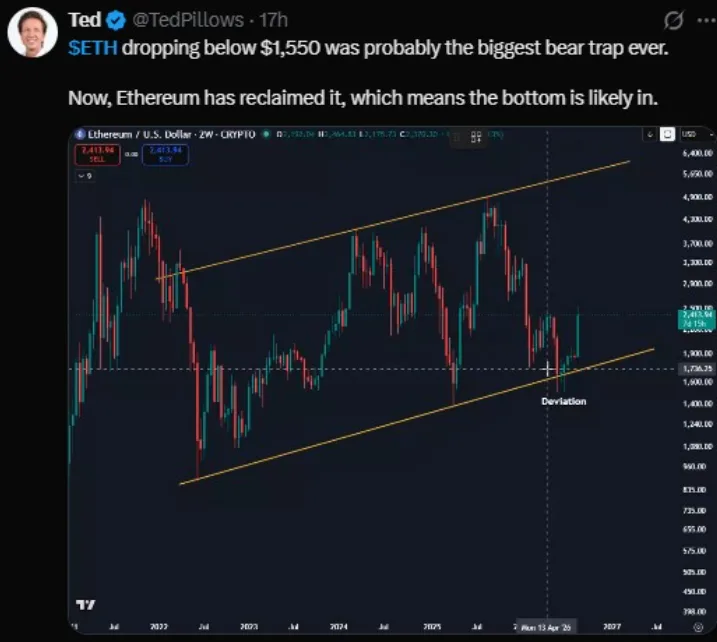
Trader Ted Pillows has also argued that Ethereum’s earlier drop below $1,550 could have been a false breakdown. ETH has since reclaimed that level. Some traders therefore believe the cycle low could already be behind Ethereum.
Tom Lee Remains Bullish on Ethereum
Fundstrat’s Tom Lee has also highlighted several signals that could support a larger Ethereum rally.

On August 17, Lee shared a chart showing ETH about 3.5% below the upper boundary of its daily Ichimoku Cloud. This area has limited Ethereum’s price since October 2025.
A sustained move above the cloud would mark Ethereum’s first breakout above this level in about ten months. Lee has also focused on Ethereum’s performance against Bitcoin. The ETH/BTC ratio recently traded near 0.02994 and has moved above a long-term downtrend.
He believes looser financial conditions could support the broader crypto market. Lee also sees growing demand for tokenized assets and blockchain-based AI agents as potential catalysts for Ethereum.
He previously linked Ethereum’s periods of outperformance to major market developments. These included the initial coin offering boom in 2017 and 2018, the NFT boom in 2020 and 2021, and the stablecoin growth seen in 2025.
Lee believes tokenized assets and AI agents could drive Ethereum’s next major period of outperformance.
In July, he predicted that Ethereum could climb back above $5,000 before the end of 2026. He also expects Bitcoin to reach six figures during the same period.
Ethereum Derivatives Show Strong Trading Activity
Ethereum’s derivatives market remains highly active.
| Metric | Value |
|---|---|
| ETH Price | $2,444.57 |
| 24h Change | +2.7% |
| Futures Volume | $48.94B |
| Spot Volume | $3.43B |
| Open Interest | $31.84B |
| Open Interest Change | +2.67% |
| Options Volume | $1.36B |
| Options Open Interest | $7.08B |
| Circulating / Total Supply | 120.68M ETH |
The figures show that traders remain heavily involved in both spot and derivatives markets.
What Do Ethereum Long/Short Ratios Show?
Ethereum’s derivatives market is showing a fairly balanced mix of bullish and bearish positions. The overall 24-hour long/short ratio stands at 1.0141, keeping the market close to neutral.

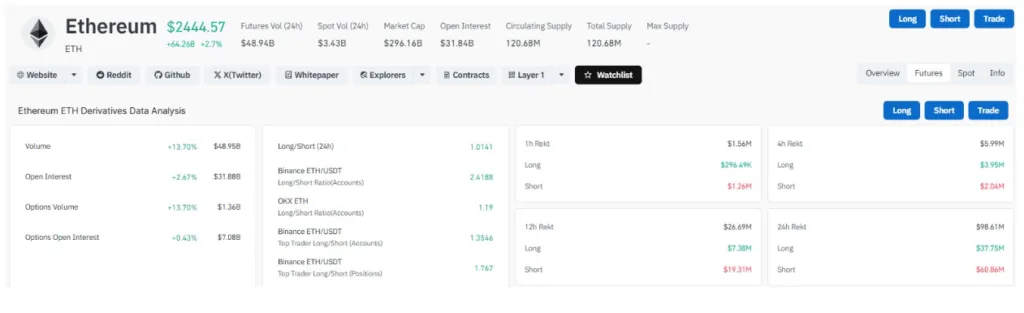
However, traders on some major exchanges are showing a stronger preference for long positions. Binance’s ETH/USDT account ratio stands at 2.4188, while OKX records a ratio of 1.19.
The figures are also more bullish among Binance’s top traders. Their account-based long/short ratio stands at 1.3546, while the position-based ratio is higher at 1.767.
Overall, the data suggests that some traders are becoming more confident in Ethereum’s potential for further gains, although the broader market remains relatively balanced.
Short Sellers Face Heavy Liquidations
Ethereum’s recent price rise has also put pressure on short sellers.
Over the past 24 hours, total ETH liquidations reached $98.61 million. Long positions accounted for $37.75 million, while short positions made up $60.86 million.
The same pattern appeared across shorter timeframes.
| Timeframe | Total Liquidations | Longs | Shorts |
|---|---|---|---|
| 1 hour | $1.56M | $296.49K | $1.26M |
| 4 hours | $5.99M | $3.95M | $2.04M |
| 12 hours | $26.69M | $7.38M | $19.31M |
| 24 hours | $98.61M | $37.75M | $60.86M |
The higher short liquidations suggest that traders betting on an Ethereum decline were caught off guard by the recent price increase.
Ethereum Starts to Outperform Bitcoin
Ethereum is also showing signs of improvement against Bitcoin.
The ETH/BTC pair has broken above a multi-month downtrend. The pair also printed a higher high, suggesting that its previous bearish structure may be weakening.
The key breakout level sits near 0.03205. Traders are watching the 0.0270 to 0.0260 region as a potential retest zone.
If ETH/BTC holds that area and forms a higher low, the pair could target 0.040. Further upside levels include 0.0500 and eventually the 0.060 to 0.070 range.
A failure to hold the breakout would weaken this bullish setup. It could also increase the risk of a failed breakout.
Tom Lee’s comments support this view. He has identified the ETH/BTC break above its long-term downtrend as one of the strongest signals for Ethereum.
Can Ethereum Reach $5,000?
Ethereum’s current setup gives bulls several reasons for optimism, but the path to $5,000 is not guaranteed.
The first major challenge is the $2,722 to $2,970 resistance zone. A decisive breakout above this area could clear a major barrier and improve Ethereum’s chances of reaching $3,000. Beyond that level, the next MVRV pricing band points toward $5,363.
Whale accumulation and nearly $440 million in ETH exchange outflows also support the bullish case. Strong derivatives activity and heavier short liquidations add further evidence of growing buying pressure.
Ethereum’s improving performance against Bitcoin is another positive sign.
Still, traders should watch the downside. A rejection from resistance could send ETH back toward the realized price near $2,235.
For now, the $5,000 target remains a bullish projection rather than a certainty. Tom Lee and Arthur Hayes both see the level as achievable if Ethereum breaks key resistance and continues to outperform.
ALSO READ: Tether vs USDC — Which Stablecoin Is Winning in 2026?
DISCLAIMER:
The views and opinions expressed herein are solely those of the author and do not necessarily reflect the views of the publisher. The publisher does not endorse or guarantee the accuracy of any information presented in this article. Readers are encouraged to conduct further research and consult additional sources before making any decisions based on the content provided.