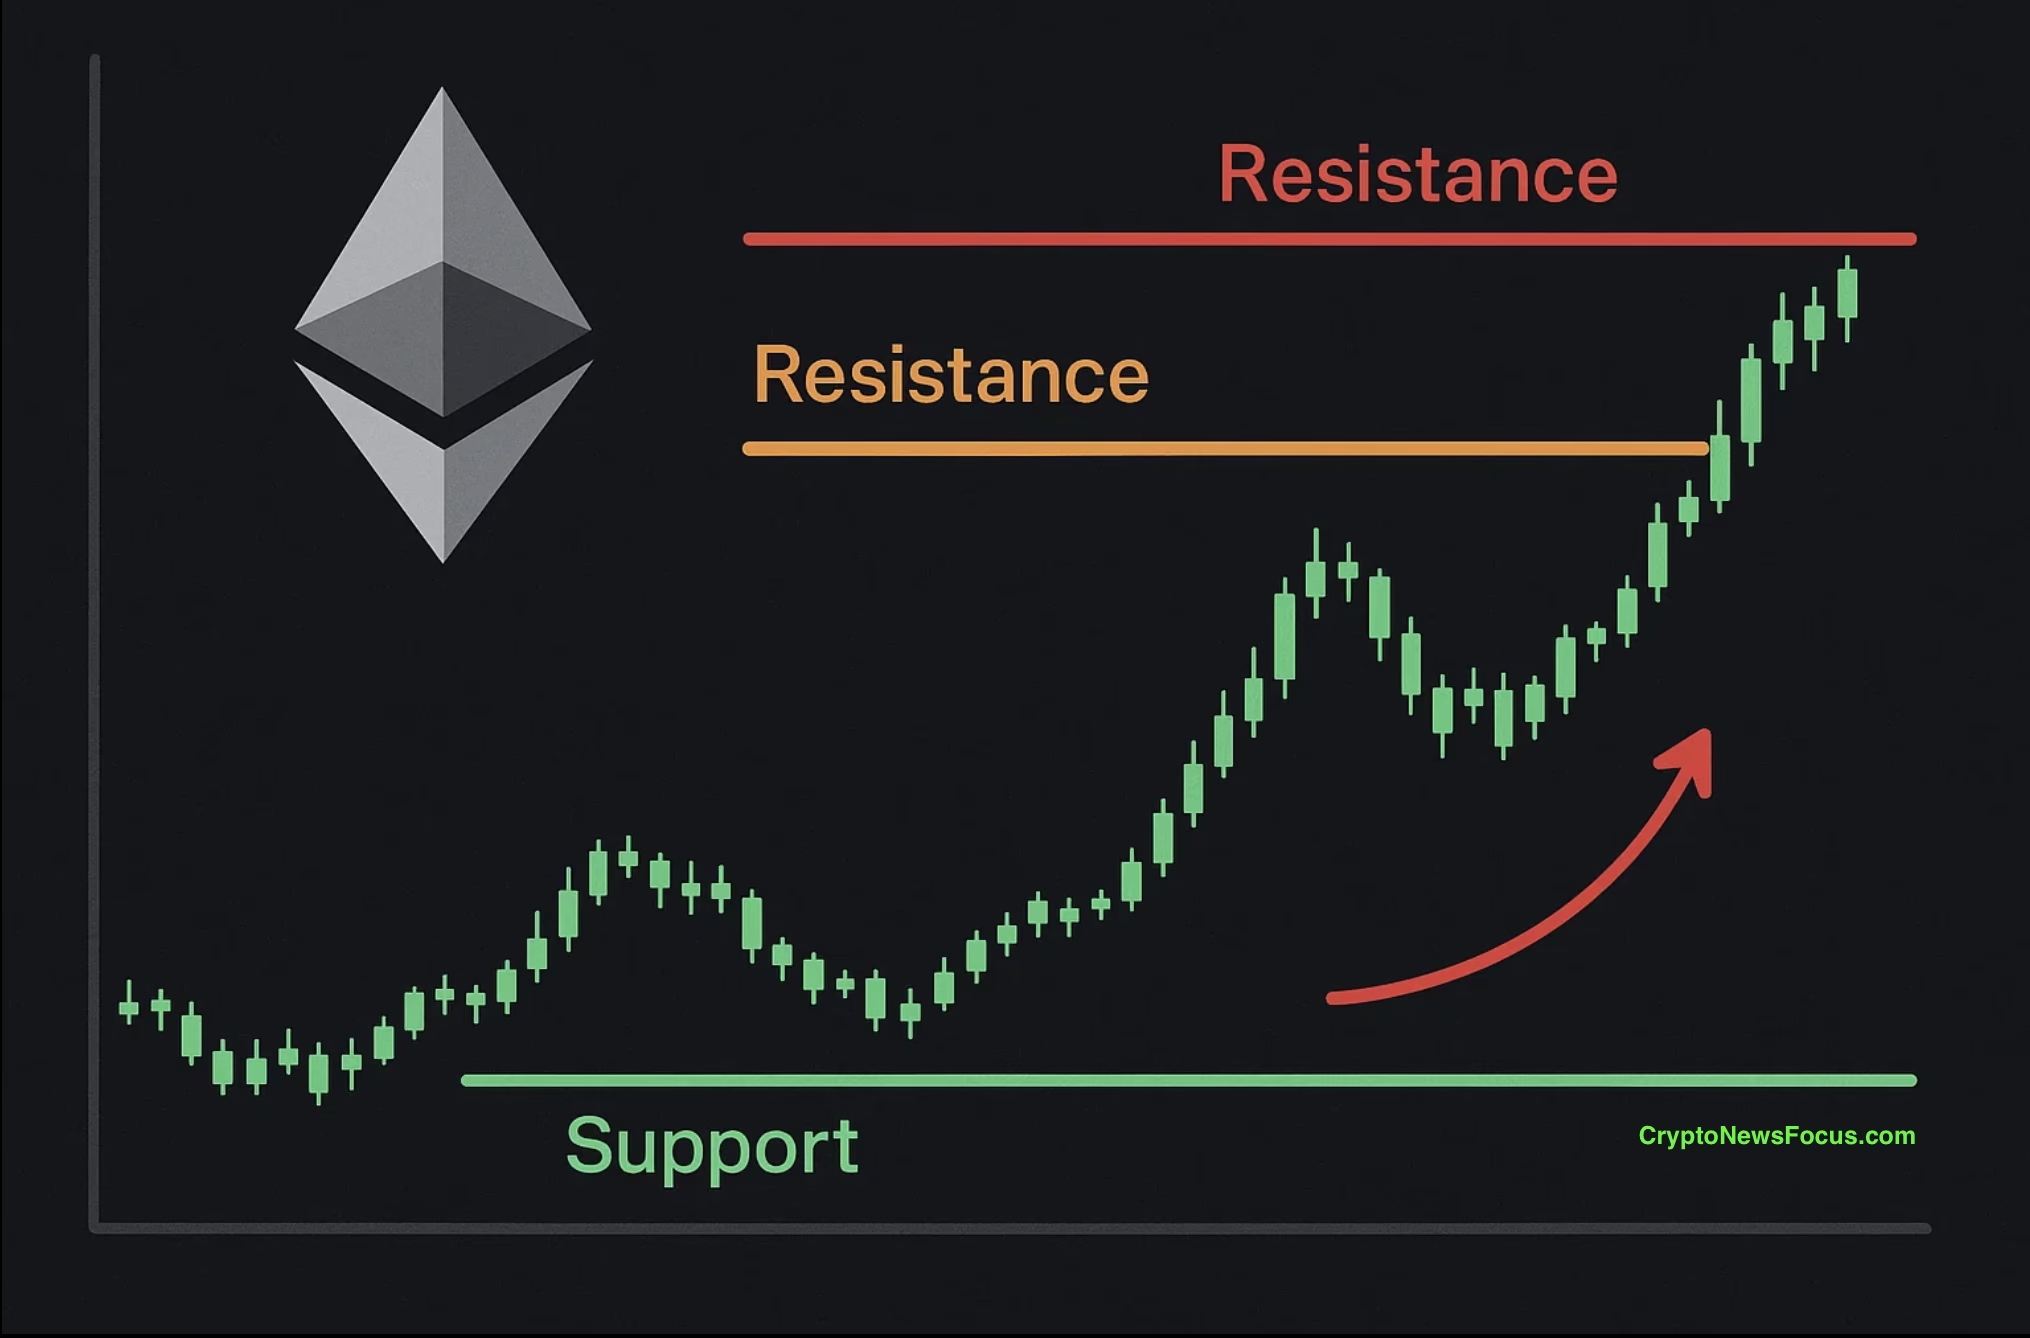
- Ethereum price rebounded above $2,100 after an 11% surge driven by market recovery and large short liquidations.
- A bullish double bottom pattern now points to a possible move toward $2,400.
The cryptocurrency market has shown signs of recovery, and Ethereum has started to respond with a notable price rebound. After weeks of uncertainty, ETH has climbed toward key resistance levels, raising the question of whether it can push further and reclaim the $2,400 mark.
Ethereum Price Rebounds as Market Sentiment Improves
Ethereum recorded a strong recovery as the broader crypto market turned positive. The coin surged more than 11%, reaching a four-week high near $2,192. This rally occurred alongside Bitcoin’s move back above $73,000, which helped lift overall market sentiment.
The price surge triggered a wave of short liquidations across the derivatives market. Data from CoinGlass shows that more than $133 million in short positions were liquidated within 24 hours, compared to about $21.5 million in long liquidations. This imbalance suggests that bearish traders were caught off guard by the rapid price recovery.
Institutional activity also appeared to support Ethereum’s rebound. According to data compiled by Farside Investors, spot Ethereum exchange-traded funds recorded inflows of approximately $169.4 million in a single day. The return of institutional demand often signals growing confidence among large investors.
At the same time, Ethereum’s open interest jumped nearly 15%, indicating a renewed increase in derivatives trading after several days of relatively quiet activity.
Double Bottom Pattern Points to Possible Reversal
Technical indicators suggest that Ethereum may be approaching a potential trend shift. On the daily chart, the asset has formed a double bottom pattern, which is widely considered a bullish reversal signal.
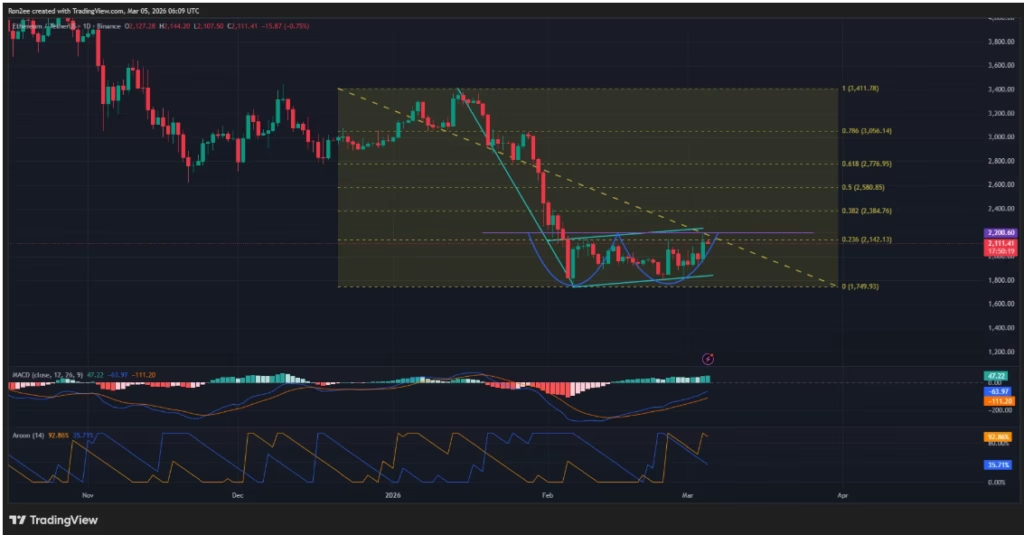
This pattern consists of two consecutive lows followed by a resistance level known as the neckline. In Ethereum’s case, the neckline sits near the $2,200 psychological resistance zone.
If Ethereum manages to break above this level convincingly, analysts believe the price could move toward $2,400. This level aligns with the 38.2% Fibonacci retracement, which often acts as a key target during trend reversals.
Reclaiming $2,400 would also invalidate a broader bearish flag structure currently visible on the chart, potentially strengthening the bullish outlook.
Technical Indicators Show Growing Bullish Strength
Several technical indicators are beginning to support the possibility of a continued upward move.
The MACD indicator has recently formed a bullish crossover, with both lines pointing upward. This development often signals increasing buying pressure in the market.
Additionally, the Aroon indicator shows strong bullish dominance. The Aroon Up reading stands at nearly 92.86%, significantly higher than the bearish Aroon Down level of around 35.71%. Such a gap typically indicates that upward price trends are strengthening.
However, traders remain cautious. A key resistance level sits near $2,142, which corresponds to the 23.6% Fibonacci retracement level. Ethereum was trading around $2,117 at the time of writing, placing it just below this important barrier.
If Ethereum breaks through these resistance levels, the path to $2,400 could become increasingly realistic.
ALSO READ: XRP Price Eyes $1.60 as Symmetrical Triangle Forms Ahead of CLARITY Act Deadline
DISCLAIMER:
The views and opinions expressed herein are solely those of the author and do not necessarily reflect the views of the publisher. The publisher does not endorse or guarantee the accuracy of any information presented in this article. Readers are encouraged to conduct further research and consult additional sources before making any decisions based on the content provided.
About the Author