
- Ethereum fell below $1,900 as retail trading activity weakened despite continued inflows into U.S. spot Ethereum ETFs.
- Buyers must reclaim the 100-day EMA at $1,937 to improve the short-term outlook and avoid a deeper pullback.
Ethereum slipped below the $1,900 mark on Friday as weakening retail participation added pressure to the market. While institutional investors continued buying through spot exchange-traded funds (ETFs), traders reduced leveraged positions, creating mixed signals for ETH’s short-term outlook.
Although Ethereum remains above important support levels, technical indicators suggest buyers still need to overcome a major resistance level before confirming a stronger recovery.
Retail Activity Slows as Futures Interest Declines
Ethereum’s derivatives market cooled after reaching its strongest level in weeks. Futures open interest fell 1.3% over the past 24 hours to $27.3 billion after climbing to nearly $29 billion earlier in the week.
The decline suggests traders are trimming leveraged positions as price momentum weakens.
Perpetual futures funding rates also lost strength during the week. On Thursday, funding briefly turned negative for the first time since late June. Negative funding rates typically show that short sellers are paying long traders, reflecting growing bearish sentiment in the futures market.
Lower leverage can reduce the risk of sudden liquidations, but it also points to reduced confidence among short-term traders.
Ethereum ETFs Continue Attracting Institutional Money
Despite the recent pullback, institutional demand has remained steady.
According to CoinGlass data, U.S. spot Ethereum ETFs recorded $14.9 million in net inflows on Thursday. The inflows marked the fourth consecutive trading session of positive investment into the products.
The continued buying suggests institutional investors remain interested in Ethereum even as retail participation weakens.
However, the Coinbase Premium Index continues to paint a different picture. The index has stayed below zero for nearly three months, showing weaker buying activity from U.S. spot investors. A return to positive territory would indicate stronger demand from retail traders and could support a broader recovery.
Ethereum Faces Key Resistance at the 100-Day EMA
Ethereum continues to trade above its short-term moving averages despite falling below $1,900.
The EMA at $1,837 and the 50-day EMA at $1,829 continue to provide immediate support. However, the 100-day EMA around $1,937 remains the biggest obstacle for buyers after repeatedly rejecting recent recovery attempts.
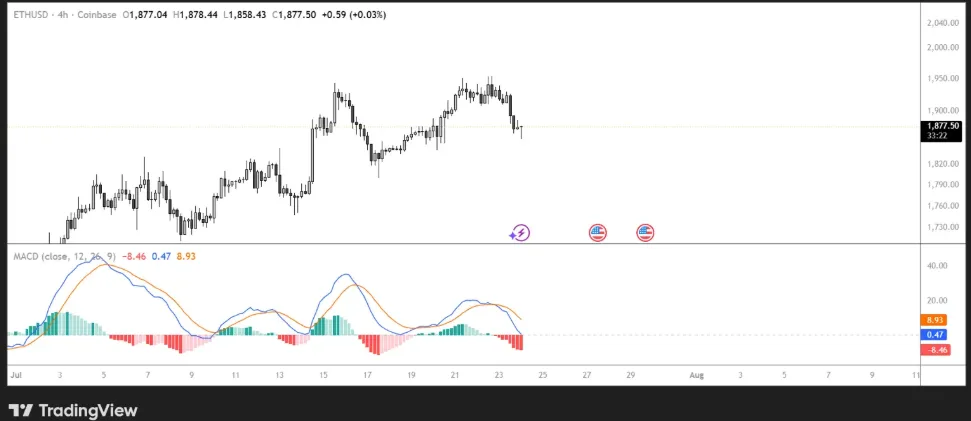
The RSI remains near 55, showing moderate buying strength without entering overbought conditions. Meanwhile, the MACD indicator remains positive but could weaken if selling pressure increases.
If buyers regain control, Ethereum could first retest $1,909 before challenging the 100-day EMA at $1,937. A daily close above that level could strengthen bullish sentiment and open the door for a move toward the $2,107-$2,108 resistance zone.
On the downside, losing support at the 20-day and 50-day EMAs could send Ethereum toward the next major support around $1,741. Maintaining support above the broader structural level near $1,524 will remain important to preserve the current recovery trend.
ALSO READ: Pi Network Recovery at Risk as Protocol v25 Meets Token Unlock Pressure
DISCLAIMER:
The views and opinions expressed herein are solely those of the author and do not necessarily reflect the views of the publisher. The publisher does not endorse or guarantee the accuracy of any information presented in this article. Readers are encouraged to conduct further research and consult additional sources before making any decisions based on the content provided.
About the Author