



- Pi Network price is gaining as PI approaches the $0.10 target, with bulls watching key resistance levels for a breakout.
- A move above $0.09643 could open the path toward $0.10391, while rejection may push PI back toward $0.08259.
Pi Network price is showing renewed strength as PI approaches the $0.10 level. The latest price action comes as traders watch key technical levels and ongoing developments across the Pi ecosystem.
PI is trading near $0.0921, up about 4.7% in the past 24 hours. The move has placed $0.10 back in focus, but PI still needs to clear several resistance levels before a stronger breakout can be confirmed.
PI Price Moves Closer to the $0.10 Target
PI is back above $0.09 after gaining around 4.7% in the past 24 hours. The move has brought the $0.10 level back into focus as bulls attempt to extend the latest recovery.
The immediate test sits around $0.09351. A break above this level could put $0.09573 next, while a stronger daily breakout would bring $0.09643 and eventually $0.10391 into view.
The setup is not yet confirmed, however. PI remains within a broader symmetrical triangle on the daily chart, meaning sellers could still push the price lower if buyers fail to clear resistance.
For now, the $0.09 area remains important. Holding above it would keep the short-term recovery intact, while a break below nearby support could send PI toward $0.08259.
Pi Network KYB Update and PayPal Rumors
Social media discussions have recently focused on a possible PayPal connection for Pi Network.


Some community speculation suggests that PayPal could support PI through a crypto payment program. However, PayPal has not been confirmed as a KYB-verified Pi ecosystem business at the time of writing.
Platforms such as OKX and MEXC have appeared on Pi’s verified business list. PayPal is not currently confirmed in the same way. Therefore, traders should treat the PayPal discussion as unconfirmed speculation rather than an established catalyst.
PI Price Analysis: Bulls Target $0.10
The 1-hour chart shows PI trading within an ascending channel. Price has continued to move between the channel’s upper and lower boundaries without a clear breakout.

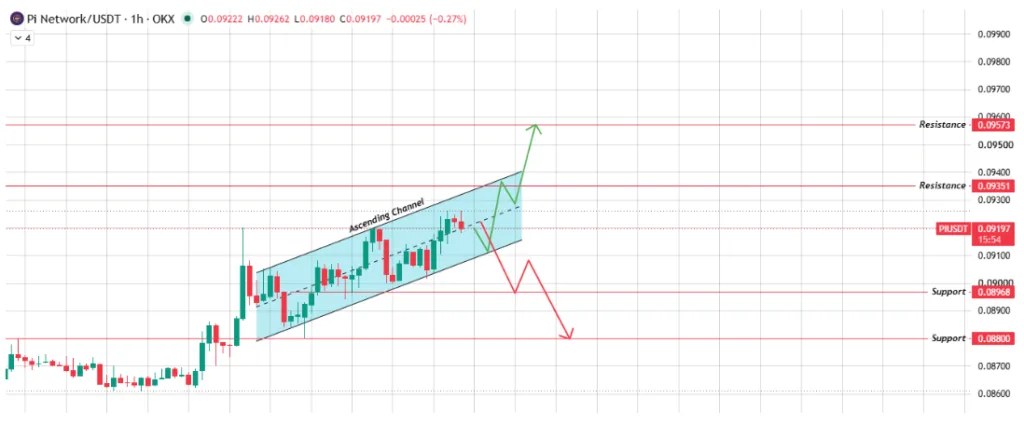
A move above the upper boundary could open the way toward $0.09351. If buyers maintain control, the next resistance sits near $0.09573.
A rejection could produce the opposite move. In that case, PI could fall toward $0.08968, followed by the $0.08800 support level.
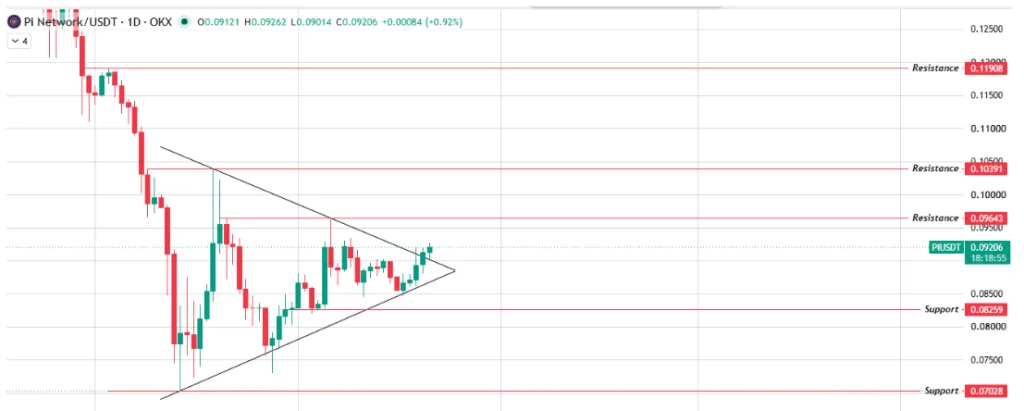
The daily chart provides a broader view. PI is currently trading around the upper edge of a symmetrical triangle. The pattern has been forming as price moves within a narrowing range. A confirmed daily breakout would strengthen the bullish case.

Can PI Reach $0.10?
A confirmed daily breakout could push PI toward $0.09643, with $0.10391 becoming the next major target. Clearing that level would take PI above the key $0.10 mark and could bring $0.11908 into focus if buyers sustain the move.
However, the breakout still needs confirmation. A rejection near the triangle’s upper boundary could send PI back toward $0.08259, while a deeper sell-off could expose $0.07028.
The Levels That Could Decide PI’s Next Move
PI is approaching a key area where the next breakout could become clearer. On the 1-hour chart, $0.09351 is the first resistance bulls need to overcome. A move above it would expose $0.09573, which could act as the final hurdle before PI tests the $0.10 area.
The daily chart gives bulls a bigger target. A confirmed breakout above the current structure would put $0.09643 in focus first. If PI clears that level, $0.10391 becomes the next major target and would place the price above the $0.10 psychological barrier.
The bearish setup starts if PI fails to hold its current range. A drop below $0.08968 could weaken the short-term structure and send PI toward $0.08800.
On the daily chart, $0.08259 is the more important support level. Holding above it would keep the broader bullish setup intact. A break below this zone could expose $0.07028, significantly weakening the current recovery.
For now, the key battle is between $0.09351 on the upside and $0.08968 on the downside. A break from this short-term range could provide the first signal of where PI heads next.
Pi Network Price Prediction: Bull, Base and Bear Cases
The bullish scenario depends on a confirmed daily breakout from the symmetrical triangle. In this case, PI could target $0.10391, with $0.11908 becoming a longer-term resistance level.
The base case points toward $0.09643 as the next major test. PI would need to hold the $0.09 area to maintain this setup.
The bearish case comes into play if PI fails to hold key support. A rejection from the triangle could push the price toward $0.08259, while a break below $0.07028 would weaken the broader setup.
Final Outlook
PI has regained ground and is now approaching the important $0.10 psychological level. The 1-hour ascending channel and daily symmetrical triangle both leave room for further gains, but neither structure has confirmed a decisive breakout yet.
For the bullish outlook to strengthen, PI needs to clear $0.09643 and then break above $0.10. Until then, traders should watch the key support levels and avoid treating unconfirmed PayPal claims as official Pi Network news.
ALSO READ: Tether vs USDC — Which Stablecoin Is Winning in 2026?
DISCLAIMER:
The views and opinions expressed herein are solely those of the author and do not necessarily reflect the views of the publisher. The publisher does not endorse or guarantee the accuracy of any information presented in this article. Readers are encouraged to conduct further research and consult additional sources before making any decisions based on the content provided.