
- Polkadot (DOT) is trading at $1.50, caught between support at $1.43 and resistance at $1.64, with mixed technical signals.
- Traders are watching for a decisive move above resistance or below support to determine the next trend.
Polkadot (DOT) is trading at $1.50 amid mixed technical signals. The coin is positioned between key support and resistance levels. Analysts suggest the coming days could determine whether DOT resumes an upward trend or faces further consolidation.
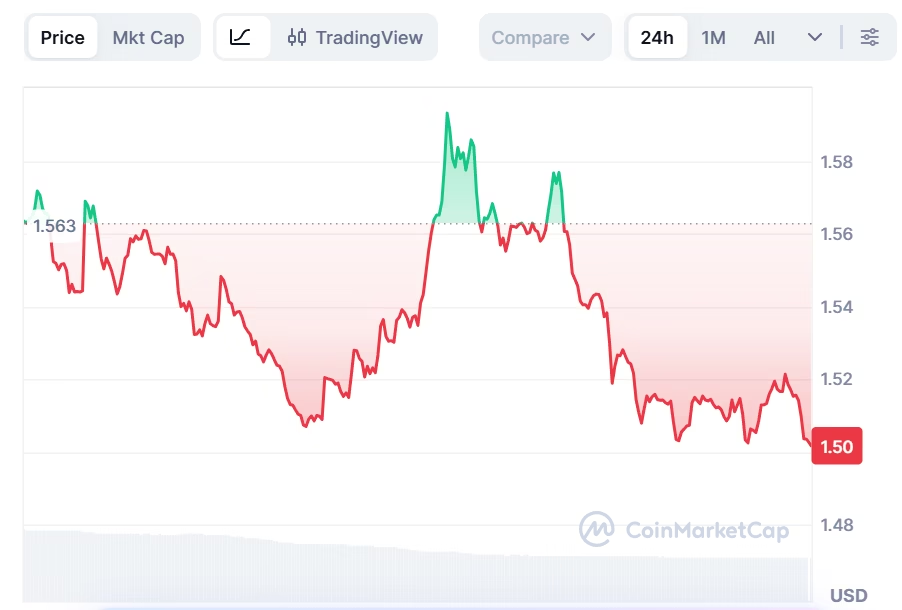
Current Market Snapshot
DOT holds above its 20-day SMA of $1.40 but remains below the 200-day SMA of $2.70, indicating longer-term resistance persists. RSI sits at 50.92, reflecting neutral momentum, while the MACD histogram at 0.0000 shows that bearish momentum has stalled. Bollinger Bands place DOT closer to the upper band at $1.68, signaling moderate upward pressure, with daily volatility measured by the Average True Range (ATR) at $0.13.
This technical positioning suggests traders are in a wait-and-see mode, anticipating a decisive move above resistance or below support to guide the next trend.
ALSO READ: Polkadot Integrates USDC With Coinbase to Improve Dollar Liquidity
Bullish Outlook: Testing $1.64
The bullish case for DOT hinges on breaking the immediate resistance at $1.57. A successful breach could see Polkadot target $1.64, representing a potential 9% gain. Should the momentum sustain beyond this level, DOT could test the upper Bollinger Band at $1.68, providing around 12% upside. Analysts note that confirming this scenario would require higher trading volumes and a rising RSI above 60 to validate stronger bullish momentum.
Bearish Risks: Support at $1.43
On the downside, failure to hold support at $1.47 may trigger a move toward $1.43, a 4–5% drop from current prices. A further breakdown below $1.43 could accelerate selling pressure toward the 20-day SMA at $1.40, with the Bollinger Band lower limit at $1.13 marking an extreme downside target.
Trading Strategies
Conservative investors may consider entering DOT positions near the $1.47 support level, while more aggressive traders could enter on confirmed breaks above $1.57. Stop-loss placements below $1.43 are recommended to manage risk. Given the neutral RSI and stalled MACD, position sizing should remain modest until clearer directional signals emerge.
Polkadot remains range-bound between $1.43 support and $1.64 resistance, with technical indicators offering mixed signals. Traders monitoring DOT should focus on price action near these key levels, as a breakout or breakdown could define the next major move in the cryptocurrency’s short-term trajectory.
ALSO READ: The Day Bitcoin Started Trading Like the S&P 500
DISCLAIMER:
The views and opinions expressed herein are solely those of the author and do not necessarily reflect the views of the publisher. The publisher does not endorse or guarantee the accuracy of any information presented in this article. Readers are encouraged to conduct further research and consult additional sources before making any decisions based on the content provided.
About the Author