


Data Signals and Market Metrics Point Towards a Possible 20% Upswing
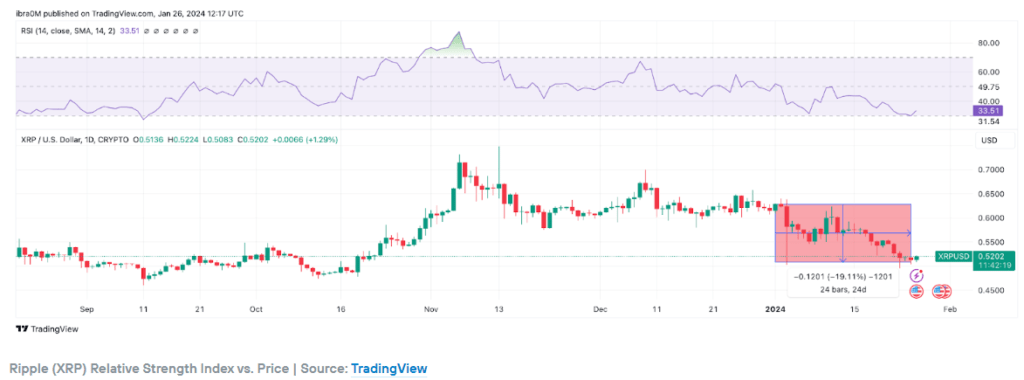
- Ripple’s XRP, currently at $0.50, shows signs of rebound as technical indicators like RSI and NVT ratio point towards oversold conditions and undervaluation.
- The analysis suggests a potential 20% upswing toward $0.60 if the bulls can stage a successful rebound, while cautioning a sharp drop if support at $0.50 fails.
Ripple’s XRP has experienced a tumultuous start to 2024, with a 19% correction pulling its price to the $0.50 mark. However, amidst the legal battles with the SEC and an overall cautious crypto market, there are signs that XRP might be on the cusp of a significant rebound.
Approaching Oversold Territory
XRP’s recent dip is attributed to the controversy surrounding Ripple’s legal disputes and the market’s hesitancy post-Bitcoin ETF approval. Nevertheless, after a month-long retracement, technical indicators suggest that XRP is now approaching oversold territory.
The Relative Strength Index (RSI), a key indicator in financial markets, dropped below the 30 threshold today, Jan. 26, signaling a potential bottom. History reveals that similar instances, such as on Sep. 11, 2023, were followed by double-digit price rallies before the end of the month, indicating a possible pattern for the coming weeks.
Undervalued Market Cap
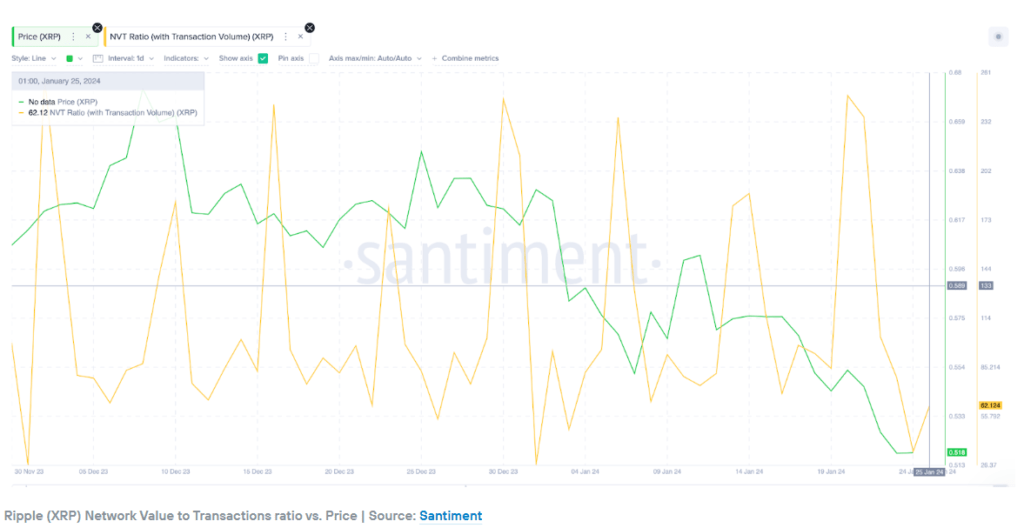
The Network Value to Transactions Ratio (NVT Ratio) further supports the idea of XRP being undervalued. Currently at 62.1, its lowest for the month, this metric compares market capitalization to the economic value of transactions on the network. A decline in the NVT ratio during a price downtrend suggests that the drop is not proportionate to a deterioration in network usage, indicating an undervalued asset.
Potential Upside
Combining the RSI and NVT ratio, the analysis suggests that XRP may be approaching a rebound phase. Existing holders are less likely to sell as losses widen, and new strategic investors might find this an opportune entry point.
Technical indicators like the Bollinger Band also align with this positive outlook. Currently approaching a reversal point at the lower Bollinger band at $0.50, a successful rebound could see XRP reaching the 20-day simple moving average (SMA) at $0.56, with a potential 20% surge towards $0.60.
Cautionary Notes
A more negative scenario is possible if the psychological support at $0.50 fails. In such a case, XRP could sharply drop towards the next psychological resistance at $0.45.
As February approaches, XRP stands at a critical juncture. Investors are eagerly watching whether the bulls can stage a rebound, unlocking the potential for a substantial upswing. The interplay of technical indicators and market metrics suggests that the coming weeks could be defining for Ripple’s XRP, offering both challenges and opportunities for investors.


+ There are no comments
Add yours