



- Solana expands its reach with a new Hong Kong spot ETF.
- However, mixed market signals keep SOL’s next move uncertain.
Solana is gaining wider access to Asian investors following the launch of the Pando Solana spot exchange-traded fund (ETF) on the Hong Kong Stock Exchange. However, SOL remains under pressure despite the new investment product, with mixed technical indicators pointing to further uncertainty in the short term.
The ETF began trading on October 13, 2026, under stock code 2831.HK. According to HashKey Exchange, it is the largest regulated Solana spot ETF in Asia by assets under management. The listing gives institutional and retail investors in the region a regulated way to gain exposure to SOL, potentially expanding demand for the cryptocurrency.
Hong Kong Solana ETF Expands Institutional Access
The Pando Solana spot ETF marks another step in the expansion of regulated cryptocurrency investment products in Asia. By offering exposure to Solana through a listed investment vehicle, the product could attract investors who prefer regulated financial instruments over directly holding digital assets.
The launch may also strengthen Solana’s position among institutional investors as regulated crypto products gain wider attention. Traders Union expert Viktoras Karapetjanc said the listing signals growing institutional interest and regulatory support for Solana in Asia.
However, the ETF’s launch does not guarantee immediate inflows or a sustained increase in SOL’s price. Its longer-term impact will depend partly on investor demand and whether the product attracts significant capital.
SOL Price Faces Mixed Technical Signals
SOL was trading near $108 at the time of the report, with technical indicators offering conflicting signals about its next move.

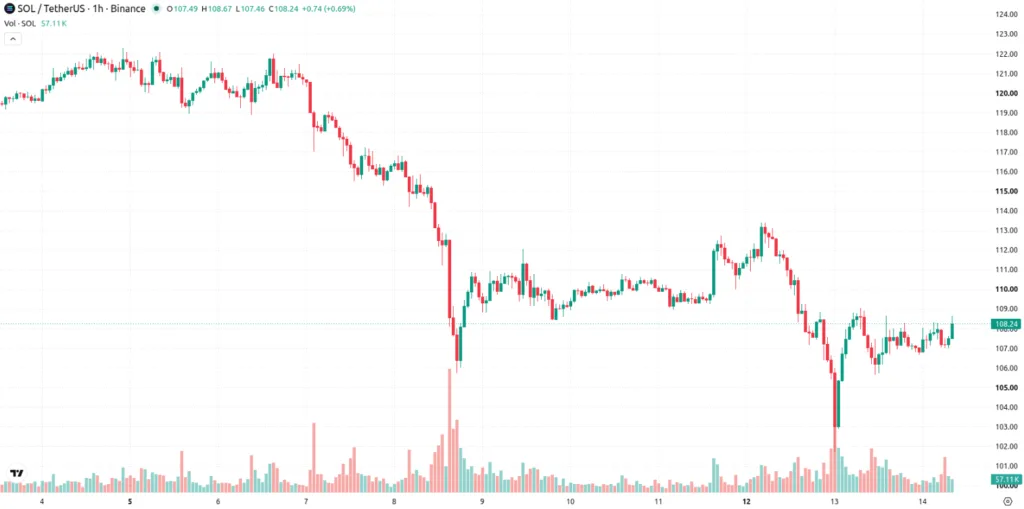
On the hourly chart, Solana was trading around its 20-period moving average of $107.34 and its 50-period moving average of $108. The daily 200-period moving average stood at $87.07, providing a longer-term support reference.
The Moving Average Convergence Divergence (MACD) indicator showed strong selling pressure, while the Relative Strength Index (RSI) stood at 48.79, suggesting slightly negative momentum. The Average Directional Index (ADX) indicated a neutral trend environment.
Other indicators offered a more balanced picture. The Stochastic RSI pointed to a potential buying opportunity, while the Commodity Channel Index (CCI) remained neutral. Bull/Bear Power also showed strong intraday buying activity, creating a contrast with the bearish MACD reading.
These mixed signals suggest that SOL has yet to establish a clear short-term direction despite the ETF launch.
Solana Price Prediction: $111.64 Resistance in Focus
Solana’s next move could depend on whether buyers can push the price above nearby resistance or sellers force it below immediate support.
According to the report’s short-term projections, SOL/USD could trade within a range of $97.79 to $111.64 over the next one to two trading days. The analysis assigns a 47% probability to an upward move and a 53% probability to a downward move, indicating a slight bearish bias.
The $107.35 level is an important near-term reference, while $111.64 represents the upper boundary of the projected range. A sustained move above resistance could improve the short-term outlook. Conversely, a break below support could expose SOL to further losses.
The wider range also highlights the uncertainty surrounding Solana’s immediate price direction, even as institutional access expands.
Can the New ETF Boost SOL Demand?
The Hong Kong listing provides Solana with another route to reach investors seeking regulated crypto exposure. If the product attracts sustained inflows, it could support demand for SOL over time.
For now, however, the market has yet to show a clear bullish response. Traders will likely watch ETF demand alongside key technical levels to determine whether the new listing can translate into stronger buying pressure.
Solana’s longer-term outlook remains supported by the expansion of regulated investment products, but near-term price action is still vulnerable to selling pressure. A decisive move above $111.64 or a break below $107.35 could provide a clearer signal of the next direction.
ALSO READ: Pi Network Price Drops 2.21% Ahead of Protocol 28 Upgrade
DISCLAIMER:
This article reflects the author’s views and is provided for informational purposes only. While we strive for accuracy, the publisher does not guarantee that all information is complete or current. Readers should verify important information and consult appropriate sources before making decisions based on this content.