- Solana is holding above $100 as SOL trades inside a tightening symmetrical triangle near key resistance.
- A break above $106 could open the way toward $109–$110.50, while a drop below $98 could expose $94.50–$96.
Solana price is holding above the $100 level after recovering from a September low of $98.38. SOL is now trading inside a tightening symmetrical triangle, with a breakout above $103 potentially opening the way toward $106 and eventually $109–$110.50.
Solana Price Recovers Above $100
SOL opened the seven-day period at $103.33 on September 8 before selling pressure pushed the price down to $98.38 on September 11. Buyers then stepped in and helped Solana recover above $100, with SOL trading around $101.50 on September 14.
Despite the recovery, Solana remained about 2.2% lower over the seven-day period. The $103–$105 region has also continued to limit several rebound attempts.
The daily chart shows SOL consolidating after climbing to around $110 in late August. That pullback came after a strong recovery from the mid-$70s, leaving the current price above the breakout area from earlier in August.
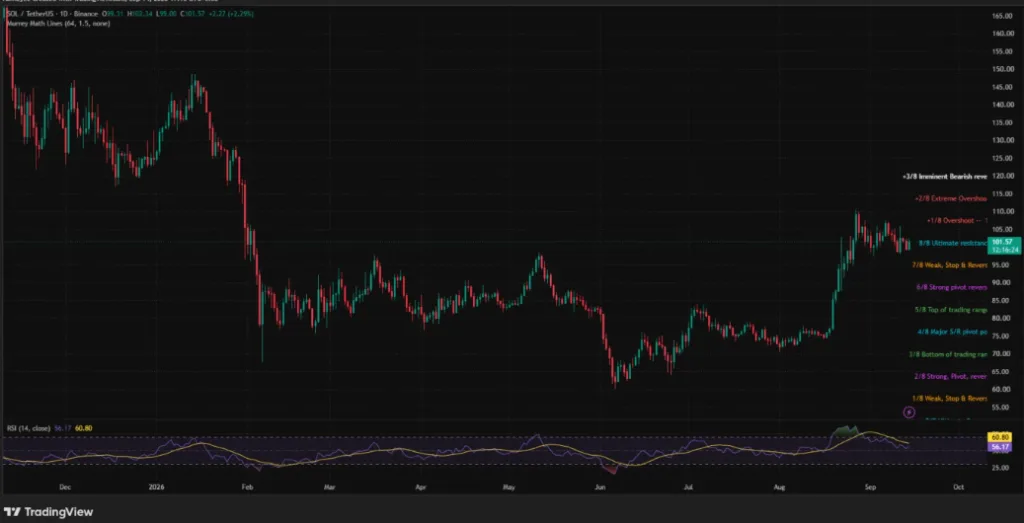
Solana’s daily Relative Strength Index (RSI) stood at 56.17, above the neutral 50 level but below its 60.80 moving average. The reading suggests that buyers still have some strength, although momentum has cooled during the recent consolidation.
SOL Forms Symmetrical Triangle Near $100
On the 4-hour chart, Solana price is moving inside a symmetrical triangle. The formation has descending resistance from the late-August high and rising support connecting the September lows.
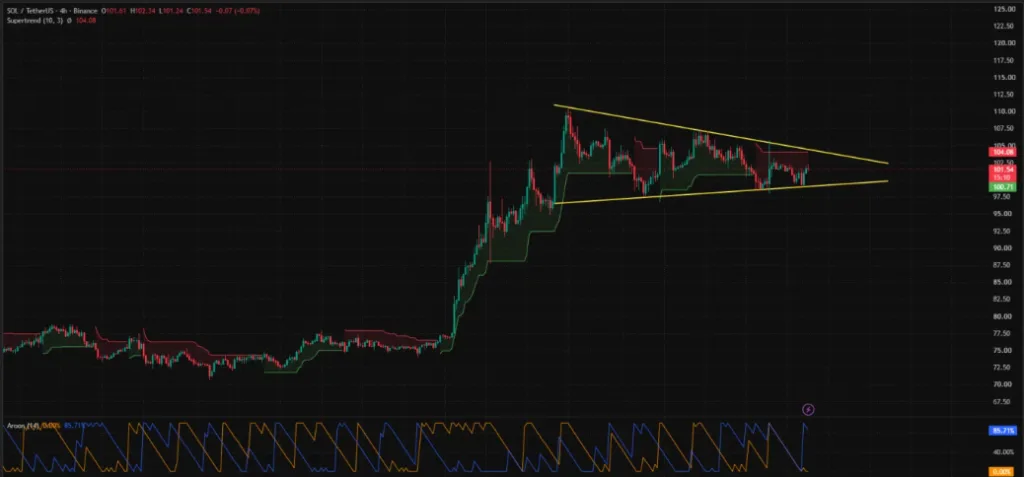
SOL was trading near $101.50, with the upper trendline around $103 and rising support near $100–$100.70. The Supertrend indicator also remained bearish at $104.08, creating another resistance level above the triangle.
A 4-hour close above $103 could put $104.08 and the $105–$106 zone in focus. A break above those levels would strengthen the short-term bullish setup.
However, Solana still needs to defend the lower boundary of the triangle. A move below this area could send SOL toward $98.50, followed by the September low of $98.38.
Because the triangle is tightening, the available trading range is becoming smaller. A confirmed candle close outside the pattern would provide a stronger signal than a brief intraday move.
Solana Faces Liquidation Clusters Around $103 and $98
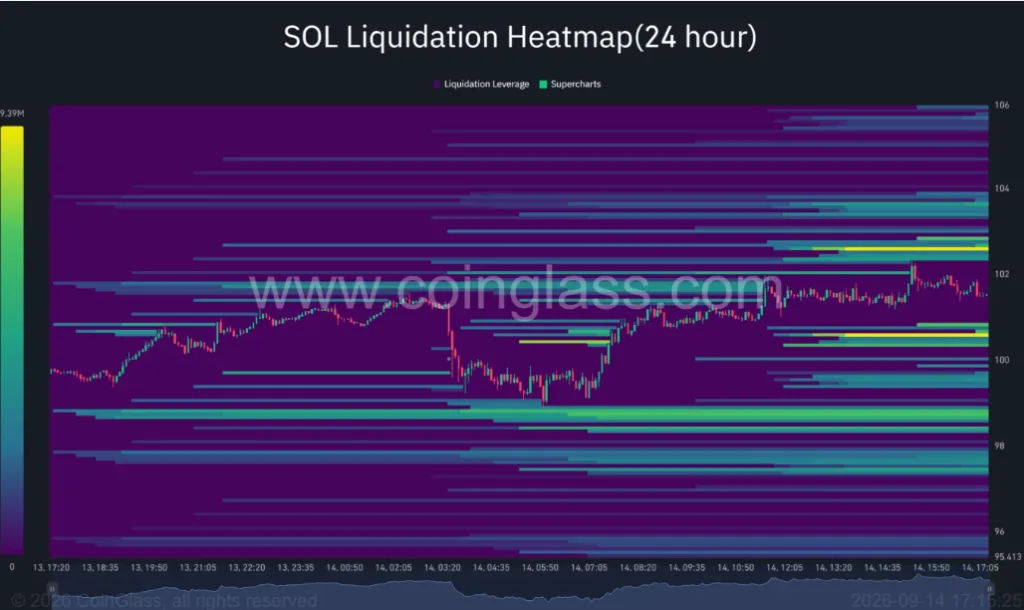
Solana’s liquidation heatmap shows large concentrations of leveraged positions on both sides of the current price. The closest upside liquidity sits around $102.60–$102.90, with another cluster around $103.60–$104.
A move above $103 could trigger short liquidations and add buying pressure as SOL approaches the $104–$106 resistance area.
On the downside, significant liquidity sits around $100.60–$100.80, while another larger cluster is positioned around $98.50–$98.80. A break below $100 could therefore expose leveraged long positions before SOL tests the stronger $98 support.
The liquidation data does not determine which direction SOL will take. It instead shows where a sharp move could accelerate if leveraged positions are forced to close.
Solana Price Needs $106 to Strengthen the Bullish Setup
Crypto analyst Ella identified $98.50–$100 as an important support zone for Solana’s broader recovery. She said daily acceptance above $106 could put the $109–$110.50 area back in focus.
For the bullish setup to strengthen, SOL first needs to hold $100, break above the triangle and reclaim the $104.08 Supertrend level. A daily close above $106 would provide stronger confirmation and put the late-August high near $110 within reach.
The bearish scenario would become more likely if Solana closes below $98 on the daily chart. Such a move could expose the $94.50–$96 area, while deeper support sits near $90.80 around the 50-day moving average.
With the Federal Reserve’s September 16 policy decision approaching, volatility could increase across major cryptocurrencies. Until SOL breaks above $106 or falls below $98, the current chart structure points to continued consolidation between these levels.
ALSO READ: IOTA Is Building a Multi-VM Blockchain
DISCLAIMER:
This article reflects the author’s views and is provided for informational purposes only. While we strive for accuracy, the publisher does not guarantee that all information is complete or current. Readers should verify important information and consult appropriate sources before making decisions based on this content.
About the Author