- Solana remains under pressure below $72 as bearish derivatives and weak technicals cap upside.
- ETF inflows offer some support but are not enough to reverse the trend.
Solana (SOL) continues to face pressure in the market after extending its recent correction below the $72 level. The coin has fallen more than 2.5% over the past two days, reflecting ongoing weakness in short-term price action despite some signs of institutional interest returning.
Solana extends correction below key levels
Solana is trading around $71.01 after another session of decline. The move keeps the asset under its recent downward trend, with price action struggling to recover meaningful ground. The broader structure remains weak as SOL continues to trade below major moving averages.
The 50-day, 100-day, and 200-day exponential moving averages remain positioned above current price levels, reinforcing a capped upside structure in the near term. This setup suggests that sellers still maintain control of the broader trend.
Institutional inflows show early signs of support
Despite the price weakness, institutional demand has shown some resilience. Spot Solana exchange-traded funds recorded an inflow of $1.06 million on Wednesday, marking the third consecutive day of inflows this week.
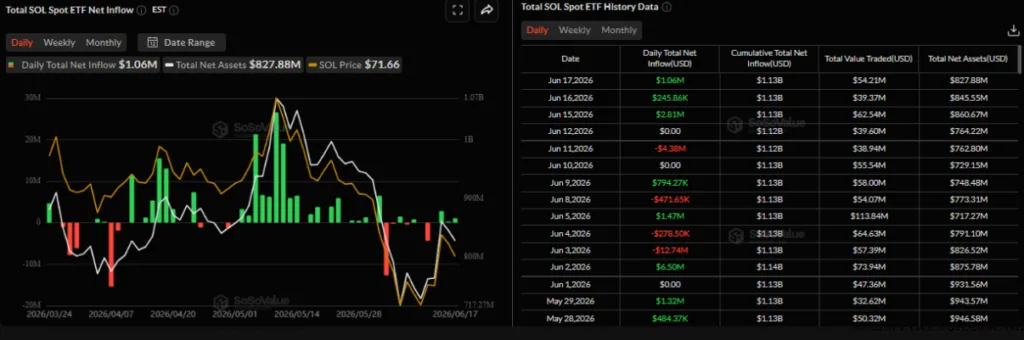
This suggests that some investors are still accumulating exposure even during the correction phase. If inflows continue to build, they could help stabilize price action and support a potential recovery attempt.
Derivatives market signals bearish sentiment
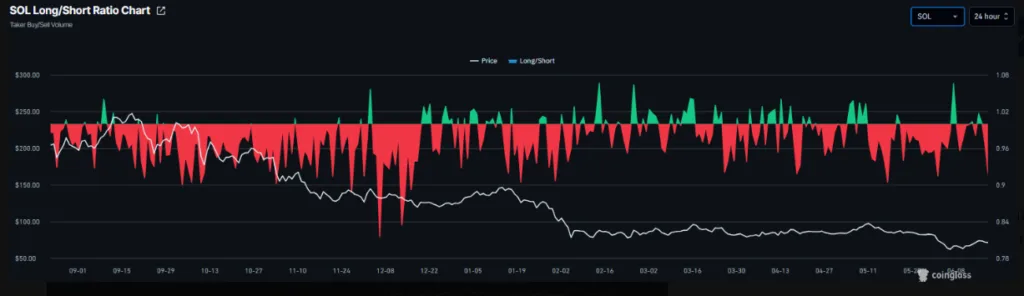
Derivatives data, however, continues to point toward caution. The long-to-short ratio for SOL stands at 0.91, showing that more traders are positioned for downside movement. A ratio below one typically reflects bearish sentiment in the market.
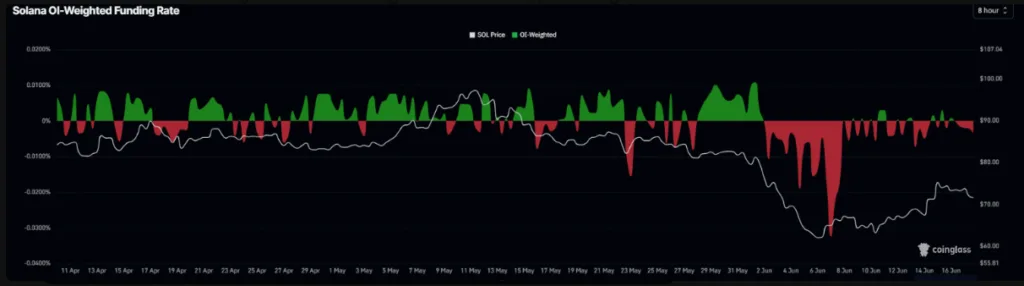
Funding rates have also turned negative, currently sitting at -0.0036%. This indicates that short traders are paying longs, a condition that often signals expectations of further price declines. Together, these metrics suggest that bearish positioning still dominates the derivatives market.
Technical outlook shows resistance overhead
From a technical perspective, Solana remains under pressure. The Relative Strength Index (RSI) is near 44, showing weak momentum even after recovering from oversold levels. Meanwhile, the MACD remains slightly positive but reflects only a limited recovery within a broader corrective structure.
Immediate resistance is seen near $74.75, followed by stronger barriers around $77.07 and $77.62. Further resistance levels appear at $79.27 and $83.79, with additional upside caps extending toward $90.22 and beyond if recovery strengthens.
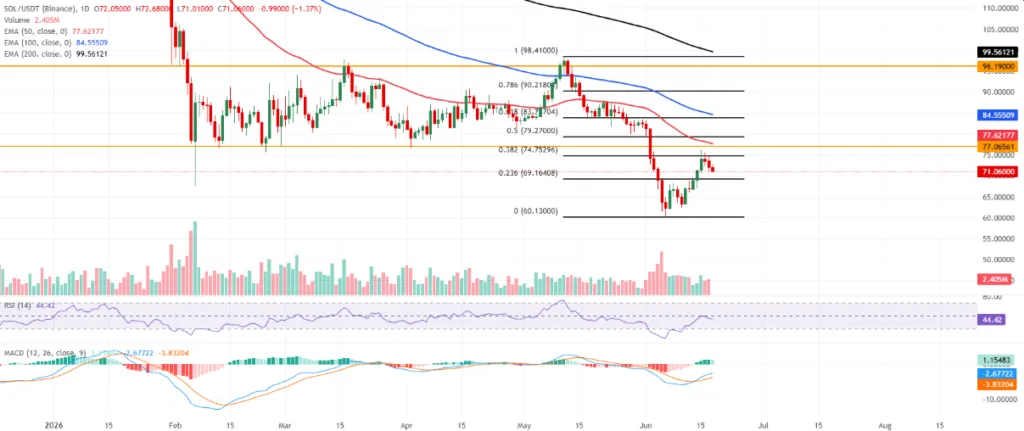
On the downside, immediate support is located around $69.16. A break below this level could expose the cycle low near $60.13, which would be the next major support zone if selling pressure increases.
Outlook remains mixed as the market balances flows and sentiment
Solana’s outlook remains mixed, with modest institutional inflows offering some support while derivatives and technical indicators continue to point toward weakness. The market appears to be in a consolidation phase, with no clear direction until either buying pressure strengthens or bearish positioning eases.
ALSO READ: Pi Network CiDi Games Earns Mainnet Verified Badge in Major Ecosystem Boost
DISCLAIMER:
The views and opinions expressed herein are solely those of the author and do not necessarily reflect the views of the publisher. The publisher does not endorse or guarantee the accuracy of any information presented in this article. Readers are encouraged to conduct further research and consult additional sources before making any decisions based on the content provided.
About the Author