
Skip to content
Crypto News Focus logo CNF_CRYPTO_NEWS_FOCUS_LOGO 8

Crypto News Focus

your day to day crypto news site

Primary Menu
  • Home
  • News
    • Bitcoin News
    • Ripple XRP news
    • Ethereum News
    • Cardano News
    • Shiba Inu News
    • Pi Network News
    • More
  • Analysis
  • PR Desk
  • About Us
  • Policy & Privacy
  • Guides
    • Bitcoin Guides
    • Pi Network Guide
    • Cardano Guide
  • More
    • Politics
    • Tech
Light/Dark Button
  • Home
  • News
  • Stellar (XLM) Explodes After Breaking 6-Year Triangle Pattern
  • Analysis
  • News

Stellar (XLM) Explodes After Breaking 6-Year Triangle Pattern

Cal Evans 1 year ago (Last updated: 1 year ago) 3 minutes read 0 comments
Stellar XLM Price
  • Stellar (XLM) has surged 80% in a week, breaking out of a 6-year symmetrical triangle and approaching key resistance at $0.47.
  • If it flips this level into support, a parabolic rally toward a new all-time high could follow.

Stellar (XLM) has taken center stage in the crypto market with an astonishing 80% surge in just one week. Despite the absence of any major news or announcements, XLM’s price action suggests that something big may be brewing beneath the surface. Now, all eyes are on a long-term pattern breakout that could push the asset to new all-time highs.

Stellar (XLM) Breaks Out of a 6-Year Triangle

After six years of coiling tightly within a symmetrical triangle, XLM is now pressing hard against the upper boundary of this technical formation. The price recently rallied with a powerful bullish candle, swiftly reclaiming lost ground and reigniting bullish sentiment.

Momentum indicators are flashing green across the board. The Relative Strength Index (RSI) has crossed above 50, while the MACD is now firmly in positive territory. This alignment supports the idea of a full breakout—an event that has the potential to spark a much larger rally.
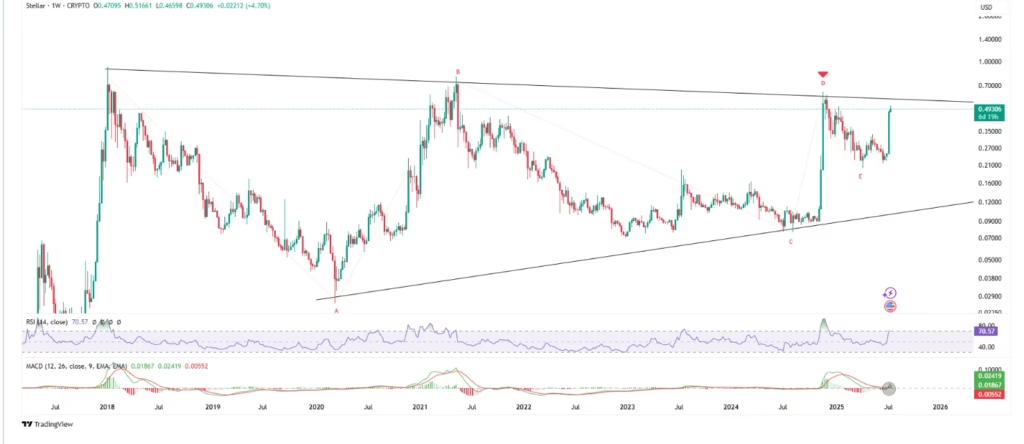
XLM/USDT price chart for 7 days period
XLM/USDT Price Chart

XLM Daily Chart Shows Strength at $0.47 Resistance

Zooming into the daily chart, Stellar has printed six consecutive green candles since breaking out of a descending parallel channel on July 8. Now, it’s approaching a key resistance level around $0.47, which coincides with the 0.618 Fibonacci retracement.
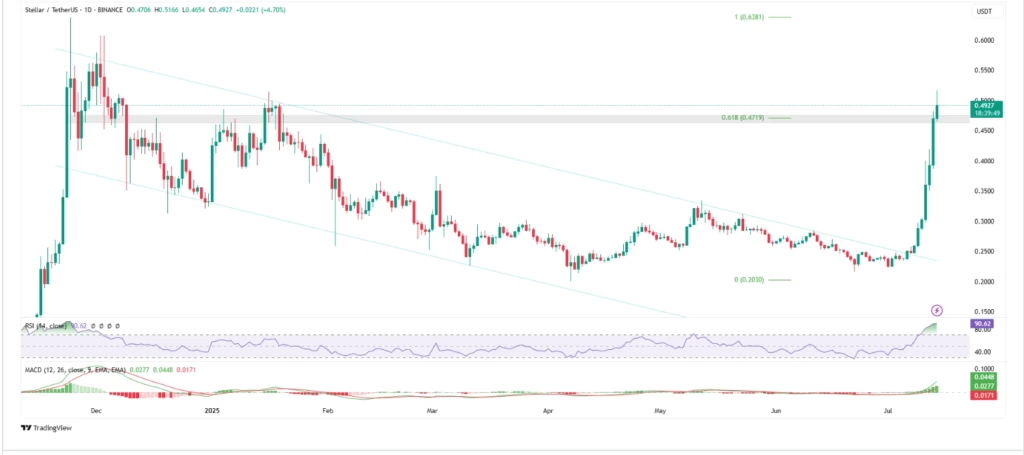
STELLAR / TETHER PRICE CHART FOR 24 HOURS PERIOD

This zone isn’t just a technical barrier—it’s a make-or-break level that could determine whether Stellar’s bullish run continues or stalls. If XLM flips this zone into support, it could mark the beginning of a rapid push toward its previous all-time high.

XRP and HBAR Could Be Next

Interestingly, Stellar’s rally appears to be part of a larger fractal pattern involving XRP and HBAR. Since April, the price action of these three assets has moved in tandem, with XLM now leading the charge. If the fractal remains valid, XRP and HBAR could be primed for similar breakouts in the coming weeks.
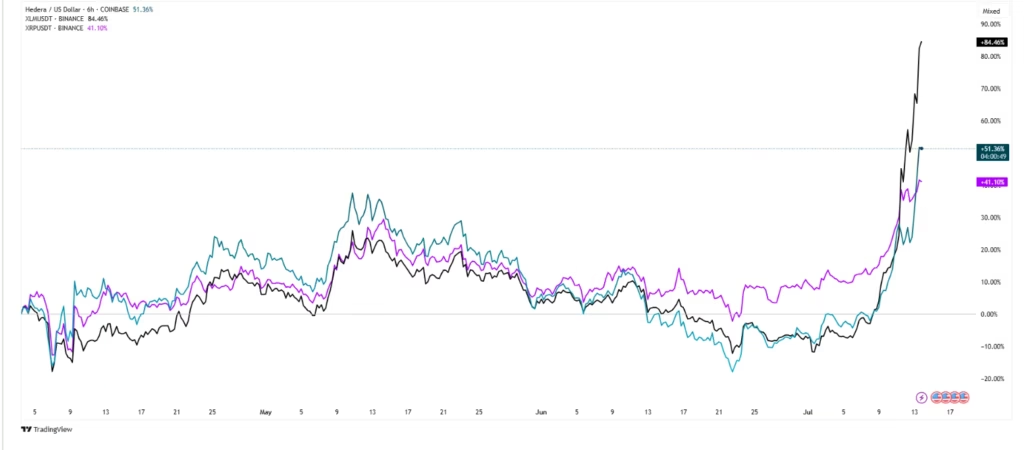
HEDERA / US DOLLAR , XLM / USDT XRP/ USDT PRICE CHART FOR 4 HOURS PERIOD

With no bearish divergences in sight and both short- and long-term charts flashing bullish signals, the stars may be aligning for Stellar. A confirmed breakout above the triangle and resistance at $0.47 could trigger a parabolic move, finally ending years of consolidation.

DISCLAIMER:
The views and opinions expressed herein are solely those of the author  and do not necessarily reflect the views of the publisher. The publisher does not endorse or guarantee the accuracy of any information presented in this article. Readers are encouraged to conduct further research and consult additional sources before making any decisions based on the content provided.

About the Author

Cal Evans

Author

Cal Evans is a technology lawyer and blockchain governance specialist with extensive experience in Web3 regulation, digital assets, and decentralized infrastructure. He has worked closely with blockchain foundations and startups, advising on compliance, token frameworks, and global regulatory strategy.

Visit Website View All Posts

Post navigation

Previous: SUI Price Climbs 10% Driven by 121% Trading Volume Increase
Next: LUNA Classic vs Terra LUNA 2.0: Understanding Terra’s Revival After Collapse

Related Stories

ZCASH IMAGE
  • Analysis

Zcash Price Breaks Above $500 as Ironwood Holds $260M in ZEC

Sean Williams 12 hours ago 0
XRP IMAGE
  • News

XRP Activity Hits 50K as Jane Street Expands ETF Stake and RLUSD Nears $1.8B

Cal Evans 13 hours ago 0
PI NETWORK IMAGE
  • News

Pi Network Set to Change App Studio Pricing on August 24

Dennis Gatheca 14 hours ago 0
Advertisement

For general inquiries, please email us at Info@cryptonewsfocus.com

Crypto news focus is your day-to-day crypto news site. Get all the latest News and trends in the crypto, blockchain, and DeFi space. For more info and inquiries, reach out via email at info@cryptonewsfocus.com

You May Have Missed

ZCASH IMAGE
  • Analysis

Zcash Price Breaks Above $500 as Ironwood Holds $260M in ZEC

Sean Williams 12 hours ago 0
XRP IMAGE
  • News

XRP Activity Hits 50K as Jane Street Expands ETF Stake and RLUSD Nears $1.8B

Cal Evans 13 hours ago 0
PI NETWORK IMAGE
  • News

Pi Network Set to Change App Studio Pricing on August 24

Dennis Gatheca 14 hours ago 0
NEAR Protocol IMAGE
  • Analysis

NEAR Protocol Hits $400K Daily Fees as Volume Surges 10x

Sean Williams 14 hours ago 0
Join our Community
  • Facebook
  • X
  • YouTube
  • LinkedIn
Our Partners MEXC MEXC
Disclaimer

Crypto News Focus provides Crypto and Blockchain news, analysis, and informational content for educational purposes only. Nothing on this website constitutes financial, investment, or legal advice.

Cryptocurrency markets are volatile. Always conduct your own research and consult a qualified professional before making any financial decisions.

Copyright © 2026 All rights reserved. | Crypto News Focus
Go to mobile version
We use cookies to ensure that we give you the best experience on our website. If you continue to use this site we will assume that you are happy with it.