
- Stellar (XLM) has surged 80% in a week, breaking out of a 6-year symmetrical triangle and approaching key resistance at $0.47.
- If it flips this level into support, a parabolic rally toward a new all-time high could follow.
Stellar (XLM) has taken center stage in the crypto market with an astonishing 80% surge in just one week. Despite the absence of any major news or announcements, XLM’s price action suggests that something big may be brewing beneath the surface. Now, all eyes are on a long-term pattern breakout that could push the asset to new all-time highs.
Stellar (XLM) Breaks Out of a 6-Year Triangle
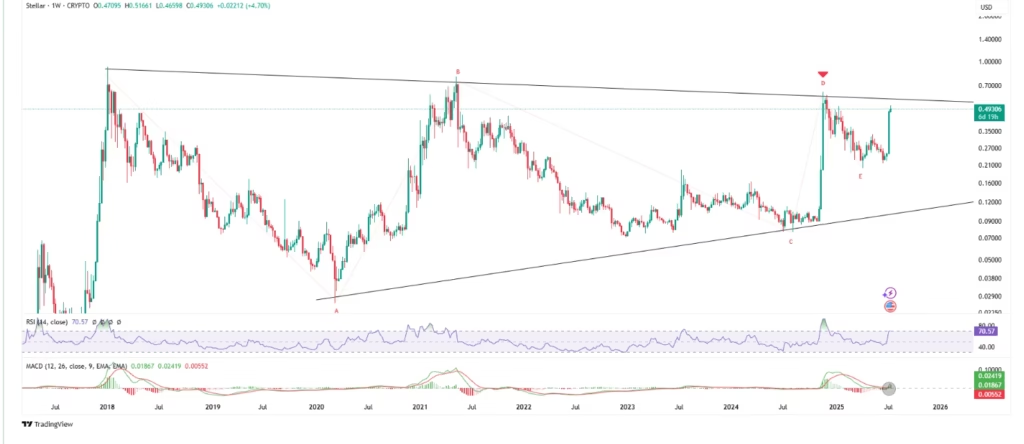
After six years of coiling tightly within a symmetrical triangle, XLM is now pressing hard against the upper boundary of this technical formation. The price recently rallied with a powerful bullish candle, swiftly reclaiming lost ground and reigniting bullish sentiment.
Momentum indicators are flashing green across the board. The Relative Strength Index (RSI) has crossed above 50, while the MACD is now firmly in positive territory. This alignment supports the idea of a full breakout—an event that has the potential to spark a much larger rally.
XLM Daily Chart Shows Strength at $0.47 Resistance
Zooming into the daily chart, Stellar has printed six consecutive green candles since breaking out of a descending parallel channel on July 8. Now, it’s approaching a key resistance level around $0.47, which coincides with the 0.618 Fibonacci retracement.
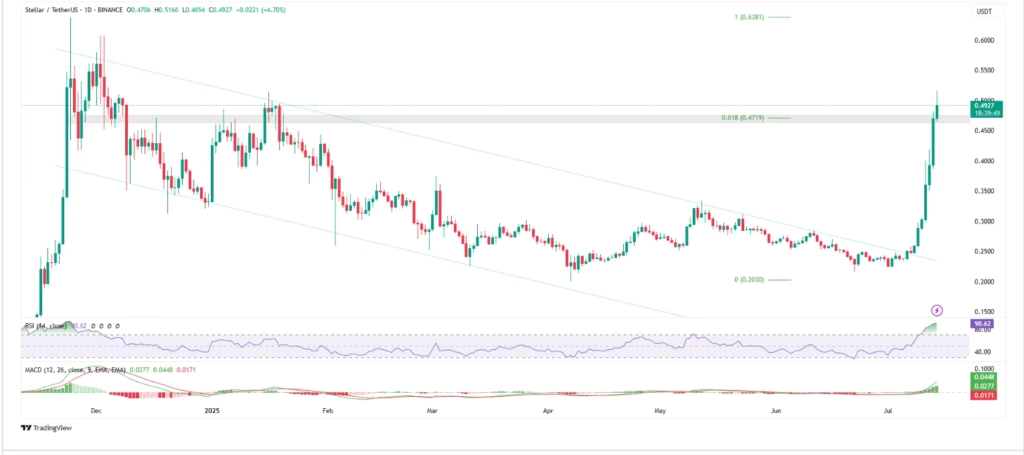
This zone isn’t just a technical barrier—it’s a make-or-break level that could determine whether Stellar’s bullish run continues or stalls. If XLM flips this zone into support, it could mark the beginning of a rapid push toward its previous all-time high.
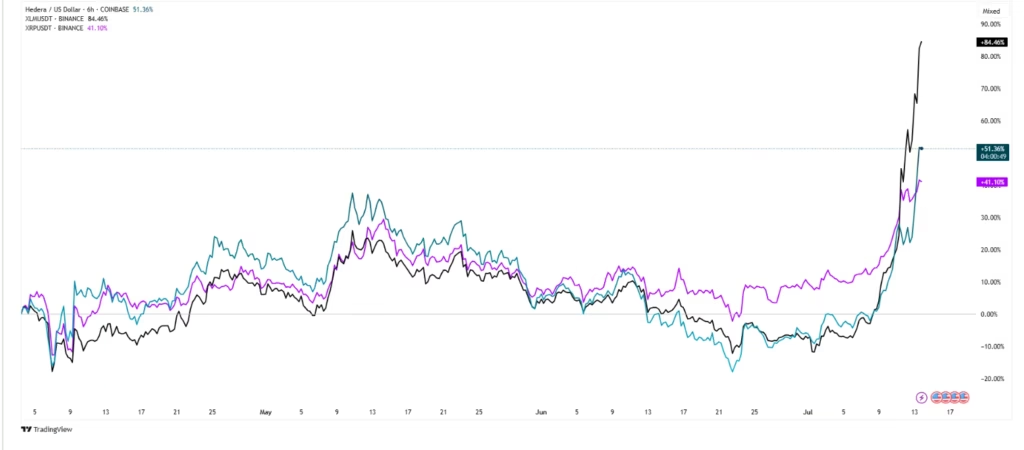
XRP and HBAR Could Be Next
Interestingly, Stellar’s rally appears to be part of a larger fractal pattern involving XRP and HBAR. Since April, the price action of these three assets has moved in tandem, with XLM now leading the charge. If the fractal remains valid, XRP and HBAR could be primed for similar breakouts in the coming weeks.
With no bearish divergences in sight and both short- and long-term charts flashing bullish signals, the stars may be aligning for Stellar. A confirmed breakout above the triangle and resistance at $0.47 could trigger a parabolic move, finally ending years of consolidation.
DISCLAIMER:
The views and opinions expressed herein are solely those of the author and do not necessarily reflect the views of the publisher. The publisher does not endorse or guarantee the accuracy of any information presented in this article. Readers are encouraged to conduct further research and consult additional sources before making any decisions based on the content provided.


