- Sui continues its rally, trading above $1.95 with strong on-chain activity, rising TVL, and increasing futures open interest, supporting a bullish outlook.
- Technical indicators suggest further gains, with bulls targeting the $2.34 resistance level.
Sui price has surged above $1.95 on Tuesday, marking a near two-month high. The rally follows six consecutive green candlesticks, highlighting strong bullish activity. On-chain and derivatives data further support the positive outlook, while technical indicators point to potential gains above the $2.34 resistance level.
Rising On-Chain Activity Signals Growing Interest
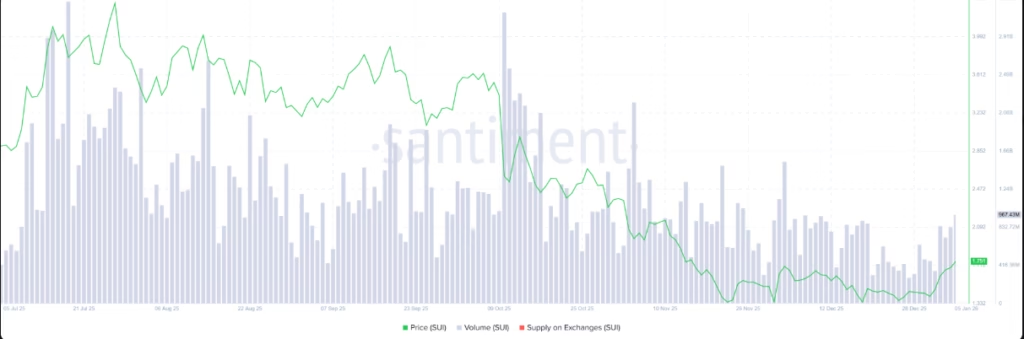
Data from Santiment shows that Sui’s trading volume across all exchange applications hit $967.43 million on Tuesday, the highest since early December. This steady rise in trading volume reflects increased participation by traders and liquidity in the SUI ecosystem, signaling stronger market interest.
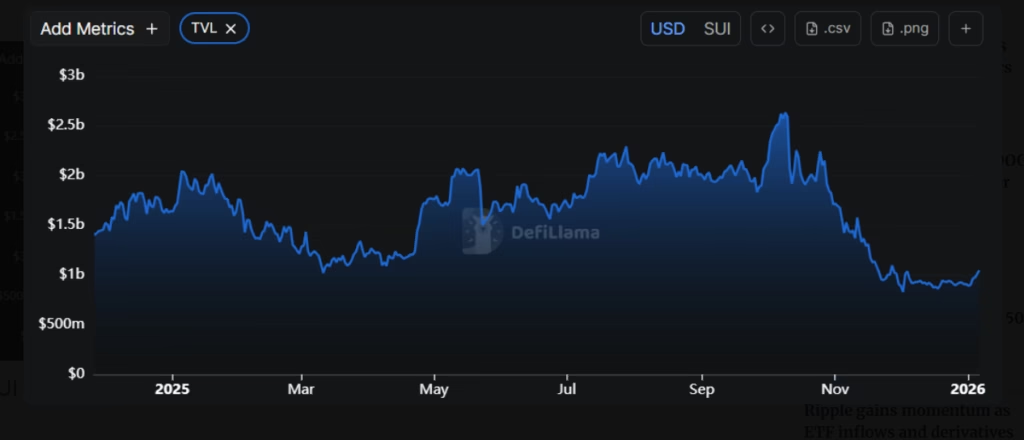
DefiLlama reports that Sui’s Total Value Locked (TVL) reached $1.04 billion on Tuesday, steadily climbing since late December. Higher TVL indicates more users are depositing or using assets on SUI-based protocols, which often strengthens the network’s fundamentals and reinforces investor confidence.
ALSO READ: Sui Partners with Figure to Launch SEC-Registered Yield Token YLDS
Derivatives Data Adds to Bullish Outlook
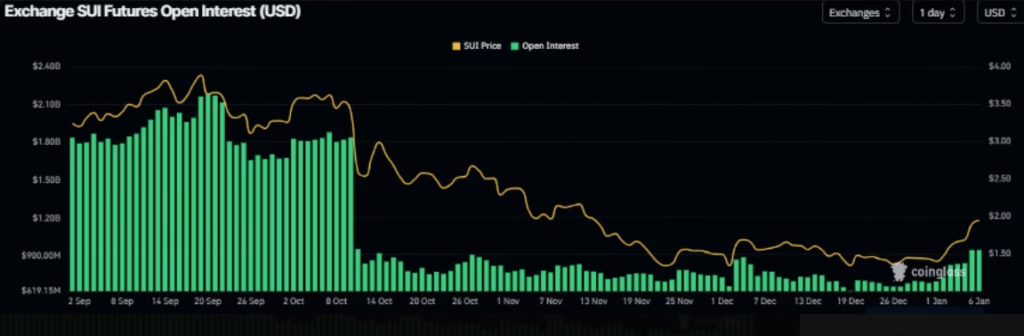
On the derivatives side, CoinGlass shows that SUI futures Open Interest (OI) surged to $947.26 million on Tuesday, up from $685 million the previous Wednesday. This marks the highest OI level since October 10, reflecting new capital flowing into the market. Rising open interest typically signals fresh buying pressure, supporting the continuation of the current rally.
Technical Analysis Points to $2.34
SUI broke above a falling wedge pattern on December 26, climbing over 35% in the following week. At the time of writing, the coin trades above $1.94, with bulls aiming for the weekly resistance at $2.34.
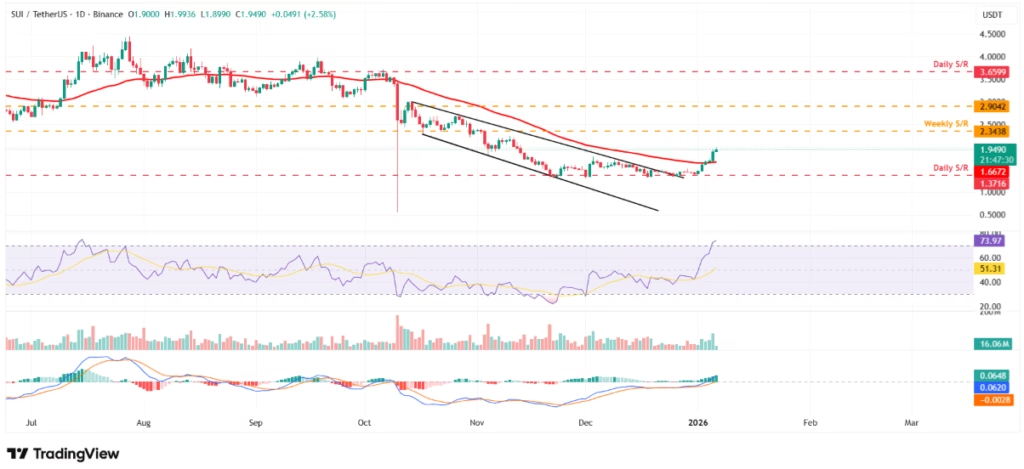
Technical indicators reinforce this bullish view. The Relative Strength Index (RSI) stands at 73, above the overbought threshold, showing strong buying pressure. The MACD also presents a bullish crossover, with green histogram bars rising above the neutral line, confirming the momentum.
However, traders should remain cautious. If SUI faces a correction, the 50-day Exponential Moving Average (EMA) at $1.66 could act as a support level, providing a potential entry point for new buyers.
Sui’s upward trajectory is supported by growing on-chain activity, rising derivatives interest, and favorable technical indicators. With bulls targeting $2.34, the coming days will be critical in determining whether SUI sustains its upward trend or undergoes a period of consolidation prior to further gains.
MIGHT ALSO LIKE: Pi Network Surpasses 15.8M Mainnet Users as Ecosystem Expands in 2026
DISCLAIMER:
The views and opinions expressed herein are solely those of the author and do not necessarily reflect the views of the publisher. The publisher does not endorse or guarantee the accuracy of any information presented in this article. Readers are encouraged to conduct further research and consult additional sources before making any decisions based on the content provided.
About the Author