- Uniswap (UNI) is trading around $9.34 and facing strong resistance near $10.85, which has stalled its recent rally.
- Technical indicators suggest possible short-term consolidation or a pullback before any breakout attempt.
Uniswap (UNI) has recently enjoyed weeks of bullish progress, but its ascent has now stalled below a key resistance zone. After touching highs near $11.68 in July, UNI has faced repeated rejection in the $10.49–$10.85 range—an area that previously capped rallies in both 2022 and early 2024.
Currently trading around $9.34 at the time of writing, the token shows signs of hesitation. A failure to break through this ceiling may trigger a short-term pullback, testing lower support levels at $8.76, $8.42, or even $7.51. Technical indicators reflect a market caught between caution and accumulation.
Weekly Resistance Still Holds Strong
On the weekly chart, Uniswap is struggling near a well-established horizontal resistance band. The Relative Strength Index (RSI) previously entered overbought territory and has now begun trending lower—an early signal that bullish strength could be waning.
Adding to the challenge is the 200-week Exponential Moving Average (EMA), which sits near this resistance and acts as a dynamic ceiling for further gains. Unless UNI can close decisively above $10.85, the threat of rejection remains in play.
Intraday Volatility Lacks Conviction
The 24-hour chart paints a picture of uncertainty. While UNI began a recent session with strong upward movement to $9.05, the price quickly slid to around $8.75 without significant volume—suggesting a controlled correction rather than panic selling.
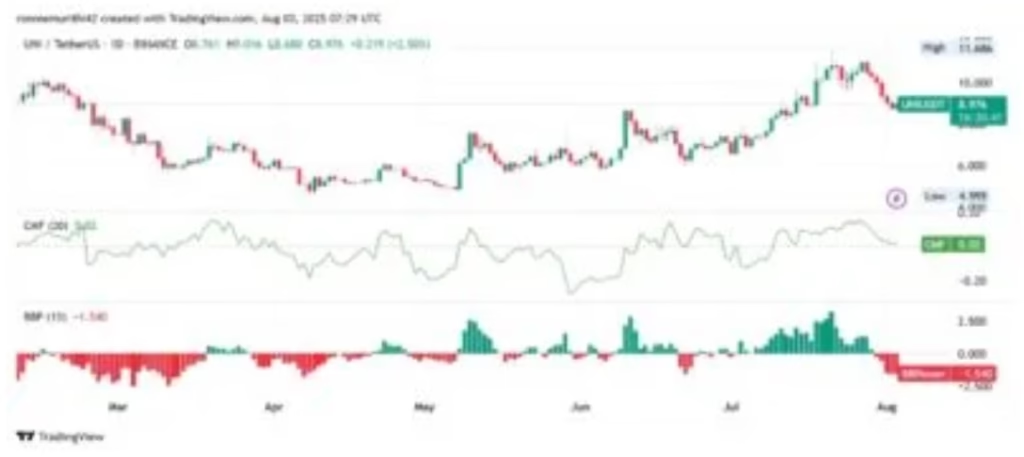
Throughout the day, the token oscillated in a narrow range of $8.75–$8.85. Late in the session, UNI recovered to $8.95 but still closed down 1.33%, highlighting continued indecision among traders.
Mixed Signals on Daily Chart Reflect Consolidation
Recent price action has been dominated by red candles, indicating short-term bearish pressure. However, a 2.12% gain on Thursday hinted at potential stabilization around the $8.60–$8.70 zone.
Momentum indicators offer a conflicted outlook. The Chaikin Money Flow (CMF) is slightly positive at 0.02, suggesting ongoing accumulation. Meanwhile, the Bear Power indicator sits at -1.530, confirming seller dominance for now. If buyer interest builds and volume returns, UNI may yet challenge its upper resistance again.
Uniswap’s path forward depends heavily on whether it can break through the stubborn $10.85 resistance. Until then, short-term consolidation or a pullback appears likely, with market sentiment hinging on future volume and strength of support.
DISCLAIMER:
The views and opinions expressed herein are solely those of the author and do not necessarily reflect the views of the publisher. The publisher does not endorse or guarantee the accuracy of any information presented in this article. Readers are encouraged to conduct further research and consult additional sources before making any decisions based on the content provided.
About the Author