- Bitcoin slipped back to around $63,000 after a brief rally above $65,000 as traders took profits ahead of the Federal Reserve’s policy decision.
- Weak institutional demand, ETF outflows, and heavy long liquidations added pressure to the decline.
Bitcoin gave up its recent gains on Tuesday after a short-lived rally pushed the price above $65,000. The pullback came as investors shifted their focus from easing geopolitical tensions to the upcoming Federal Reserve policy decision, while institutional demand remained weak.
Bitcoin Rally Loses Steam
Bitcoin climbed above $65,500 on Monday after reports indicated that military strikes between the United States and Iran had paused, easing fears of a broader conflict in the Middle East.
Investor sentiment improved further after reports revealed that Iranian and Omani officials were discussing ways to restore maritime traffic through the Strait of Hormuz. The development reduced concerns over potential disruptions to global oil supplies, causing crude oil prices to fall while U.S. stock markets moved higher.
As risk appetite returned, the S&P 500 and Nasdaq Composite both posted modest gains, helping Bitcoin briefly reclaim the $65,000 level. The optimism, however, faded quickly. By Tuesday, traders shifted their attention away from geopolitical developments and back to macroeconomic concerns, particularly the upcoming Federal Reserve interest rate decision.
At the time of writing, Bitcoin was trading around $63,270, down roughly 3% over the previous 24 hours. The decline erased Monday’s gains and pushed the price back near the levels seen before the relief rally.
ETF Outflows Add Pressure
Institutional demand remained weak despite Bitcoin’s brief rally above $65,000. U.S. spot Bitcoin ETFs recorded $11.64 million in net outflows on July 27, suggesting some investors reduced their exposure instead of buying into the price recovery.
Investor focus also shifted back to the Federal Reserve’s upcoming policy decision. Expectations that interest rates could remain higher for longer continued to weigh on risk assets, while many traders chose to lock in profits after Monday’s rally, adding pressure to Bitcoin’s decline.
Long Liquidations Accelerated the Decline
Selling pressure increased after Bitcoin fell below key short-term support levels. The break triggered a wave of liquidations across the derivatives market, adding to the downward move.
More than $156.8 million worth of Bitcoin positions were liquidated over the past 24 hours. Around $133.5 million of those liquidations came from long positions.
During the last 12 hours alone, exchanges liquidated more than $106 million in leveraged long positions. The sharp reversal caught many bullish traders off guard.
When these positions are automatically liquidated, exchanges sell the underlying assets into the market. The additional sell orders accelerated Bitcoin’s decline and pushed the price back toward the $63,000 region.
Bitcoin Price Faces Key Resistance
Bitcoin is once again trading below several important moving averages, which points to weak short-term momentum.
The price has slipped beneath both the 20-day and 50-day after failing to hold Monday’s recovery. It also remains well below the 100-day and 200-day, showing that the broader trend has not fully recovered.
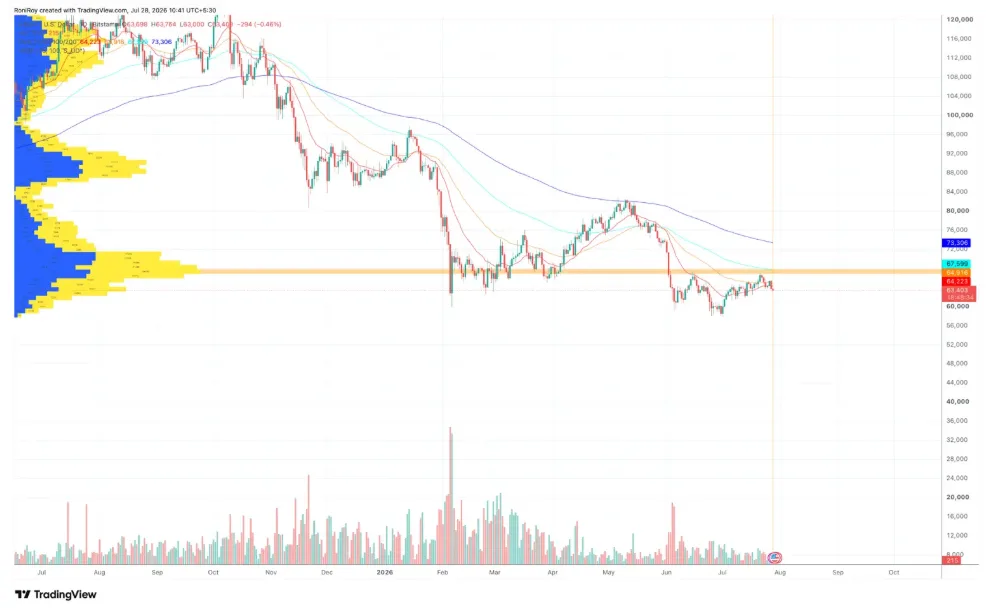
The $64,800 to $65,000 range continues to act as strong resistance. Bitcoin has been rejected from that area several times in recent months, making it a key level that buyers must overcome.
Technical indicators on the four-hour chart also show renewed weakness after Bitcoin dropped below several support levels and moved back into a bearish short-term structure.
Key Levels to Watch
Bitcoin is now trying to stabilize around the $63,000 to $63,300 support zone after Tuesday’s sell-off. Holding above this level could help buyers regain some control, while a break below it could expose the recent swing low between $60,000 and $61,000, which served as important support earlier this month.
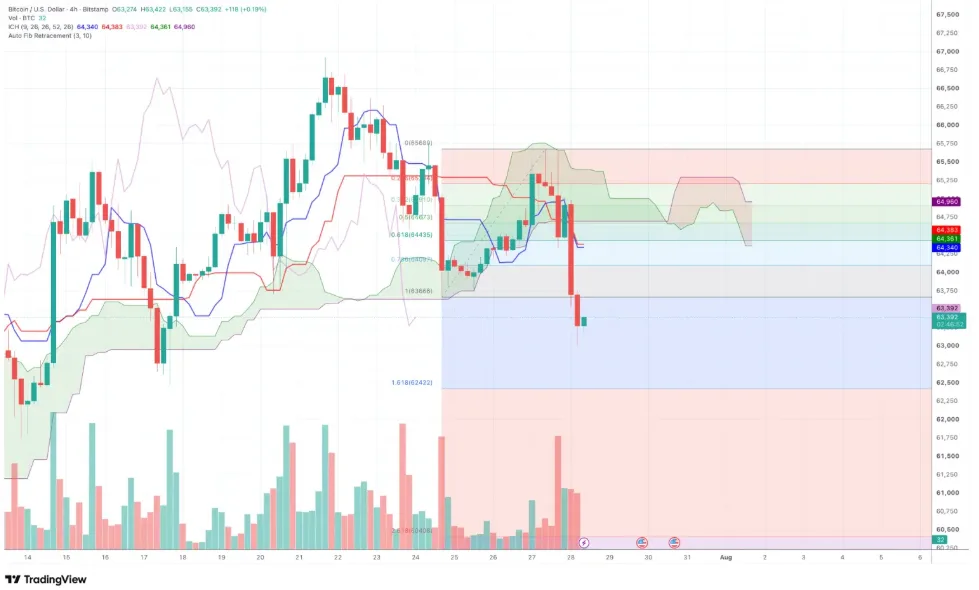
On the upside, Bitcoin first needs to reclaim the 20-day and 50-day EMAs, which are now acting as immediate resistance after the latest pullback. Beyond that, the $64,800 to $65,000 range remains a key barrier, as sellers have repeatedly defended this zone over the past few months.
A decisive move above $65,000 would improve the short-term outlook and could pave the way for another test of the $66,000 to $67,000 region. Until then, traders are likely to watch these support and resistance levels closely for the next directional move.
DISCLAIMER:
The views and opinions expressed herein are solely those of the author and do not necessarily reflect the views of the publisher. The publisher does not endorse or guarantee the accuracy of any information presented in this article. Readers are encouraged to conduct further research and consult additional sources before making any decisions based on the content provided.
About the Author