- Bitcoin shows early signs of a bear market as the Realized Profit/Loss Ratio weakens and network activity slows significantly.
- Key support at $66,550 remains crucial, with a breakdown risking a deeper decline toward $60,000 and below.
Bitcoin (BTC) has recently experienced a pullback, raising concerns that the world’s largest cryptocurrency could be entering a new bear market. While price action remains above critical support, several on-chain metrics suggest structural weakness is building beneath the surface.
Realized Profit/Loss Ratio Points to Bearish Transition
The Realized Profit/Loss (P/L) Ratio, which tracks the balance between realized gains and losses, has compressed into the 1–2 range. Historically, this zone marks the early stages of bear market transitions, where realized losses begin to dominate market activity.
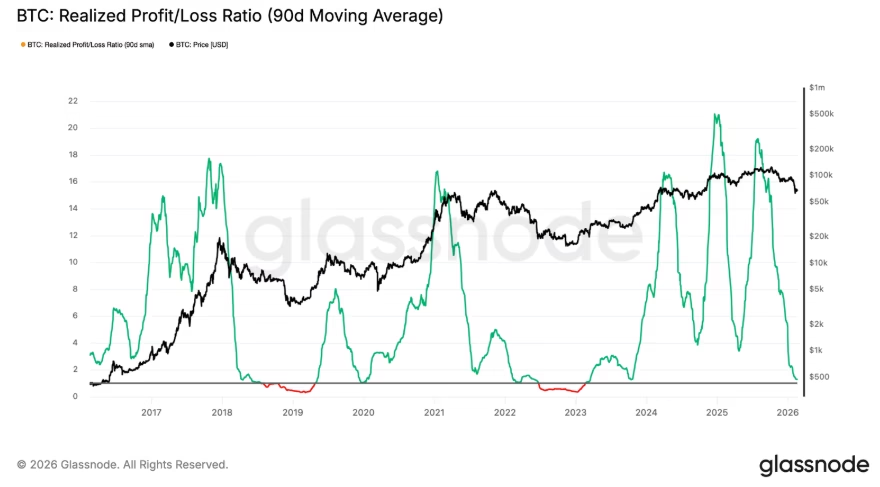
Currently, the ratio’s 90-day moving average has yet to reclaim levels above 2, signaling limited profit-taking and weak capital rotation. Until a decisive shift occurs, broader market conditions may remain tilted toward caution, implying that investors could face continued downside pressure in the weeks ahead.
Network Activity Shows Slowing Growth
Bitcoin’s network data also hints at potential stress. Active BTC addresses have declined sharply, with 42% fewer unique addresses making transactions compared to five years ago. New address creation has fallen by 47%, indicating slowing adoption despite BTC’s price resilience.
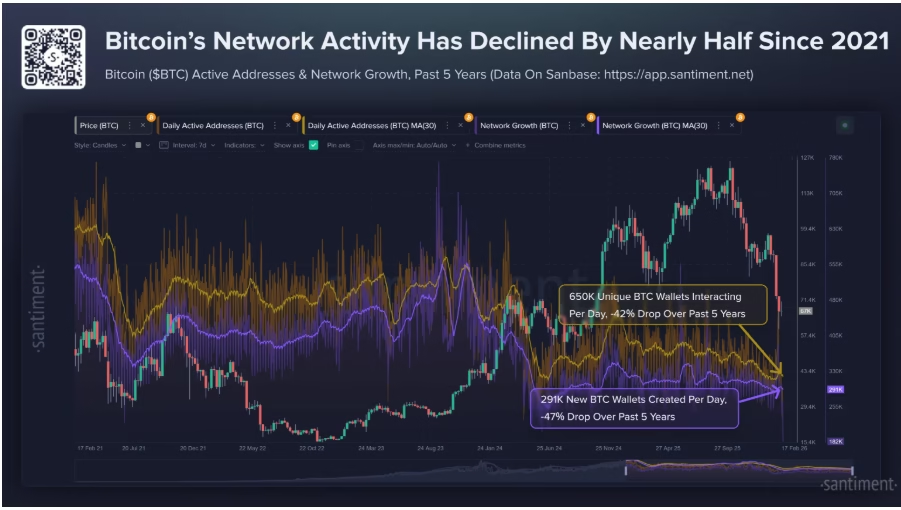
Historically, strong bull cycles coincide with expanding user participation and wallet creation. Without renewed growth in network activity, any recovery may struggle to sustain itself organically, leaving BTC vulnerable to extended consolidation or decline.
Key Price Levels to Watch
At the time of writing, Bitcoin trades near $66,721, slightly above the crucial $66,550 support zone. This level has prevented a sharper breakdown but remains under pressure from a persistent downtrend that began in late January.
A failure to maintain support could drive BTC toward $60,000, with a deeper decline to $52,775 possible if selling intensifies. Conversely, a rebound above $71,693 and the short-term 20-day EMA would signal improved investor confidence. Surpassing $80,000 would further confirm a potential recovery in the long-term trend.
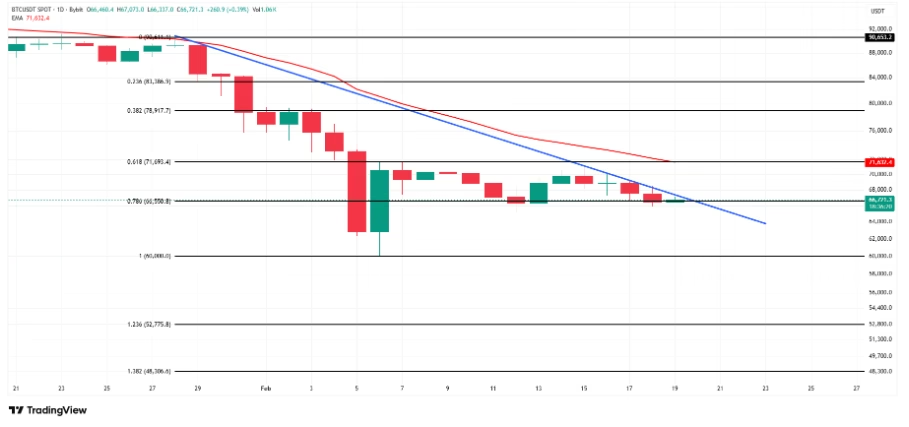
While BTC has yet to decisively break key support levels, on-chain metrics such as the Realized P/L Ratio and declining network activity signal early bear market stress.
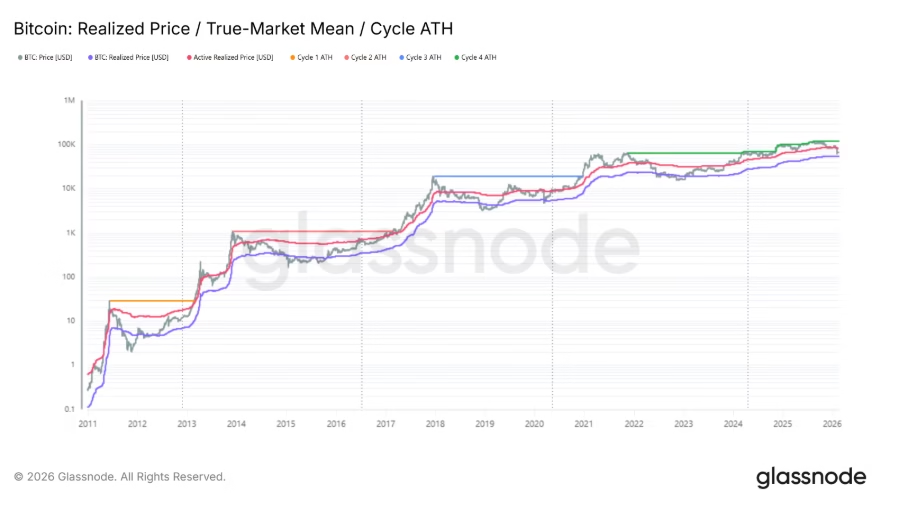
Investors should monitor price action closely around $66,550, as a sustained breakdown may mark the start of a prolonged bearish phase, while a strong recovery above resistance levels could restore market confidence.
ALSO READ: XRP Velocity Surges to One-Year High Despite Price Dropping Below $1.50
DISCLAIMER:
The views and opinions expressed herein are solely those of the author and do not necessarily reflect the views of the publisher. The publisher does not endorse or guarantee the accuracy of any information presented in this article. Readers are encouraged to conduct further research and consult additional sources before making any decisions based on the content provided.
About the Author