- Bitcoin fell below $59,000 as bearish signals strengthened.
- Technical and on-chain data now point to $54,000 as the next key support.
Bitcoin extended its losses on Thursday after falling below the important $59,000 level. The decline came as selling pressure spread across financial markets, with weakness in major technology stocks reducing investor appetite for risk assets. At the same time, multiple technical indicators suggested that Bitcoin could face further downside in the short term.
Bitcoin Breaks Key Support as Selling Pressure Increases
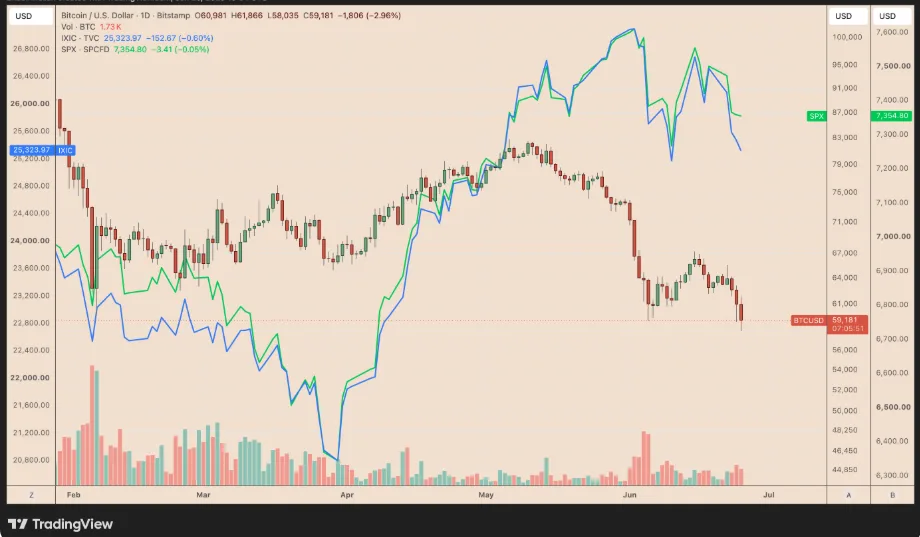
Bitcoin erased all of its June gains after dropping below the $59,000 mark. The coin fell as much as 4.8% during Thursday’s trading session, reaching an intraday low near $58,000.
Source: TradingView
The latest decline coincided with a broader sell-off in technology stocks, which also affected other risk-sensitive assets. As investors reduced exposure to risk, cryptocurrencies came under renewed pressure.
The move below a major psychological support level also confirmed several bearish chart patterns, increasing concerns that the correction may not be over.
Round-Top Pattern Signals More Downside
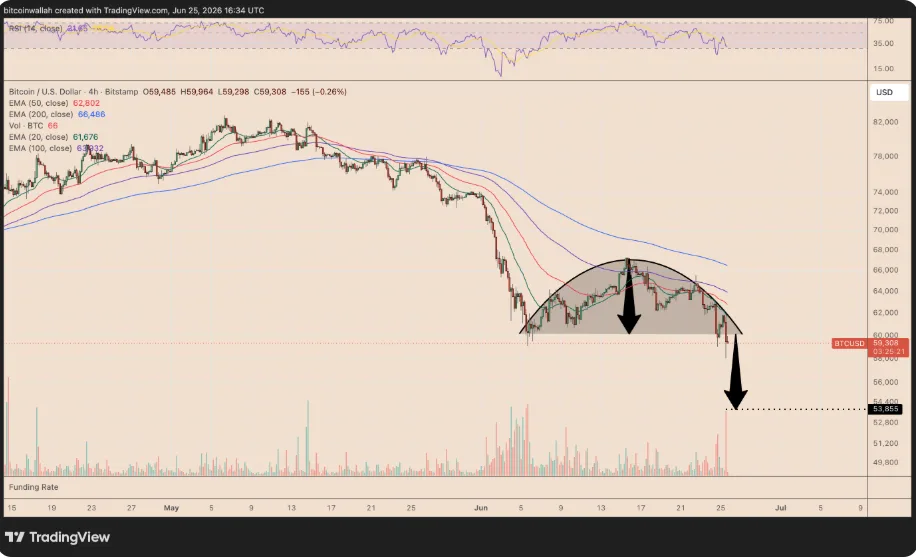
One of the strongest bearish signals appeared on Bitcoin’s four-hour chart, where a rounded top pattern completed after the price broke below its neckline support.
Source: TradingView
A rounded top forms when buying pressure gradually fades. Instead of making stronger highs, the price begins to curve downward before breaking key support. This often marks the transition from an uptrend to a downtrend. Based on the measured move of this pattern, Bitcoin could decline toward the $54,000 region. That would represent an additional drop of nearly 9% from current levels.
The completion of this pattern suggests that sellers remain firmly in control unless buyers reclaim important resistance levels.
Daily Bear Flag Supports the Same Target
The bearish outlook becomes stronger on the daily chart. Bitcoin has also broken below a bear flag pattern, another widely followed technical formation that often signals the continuation of a downward trend after a brief recovery.
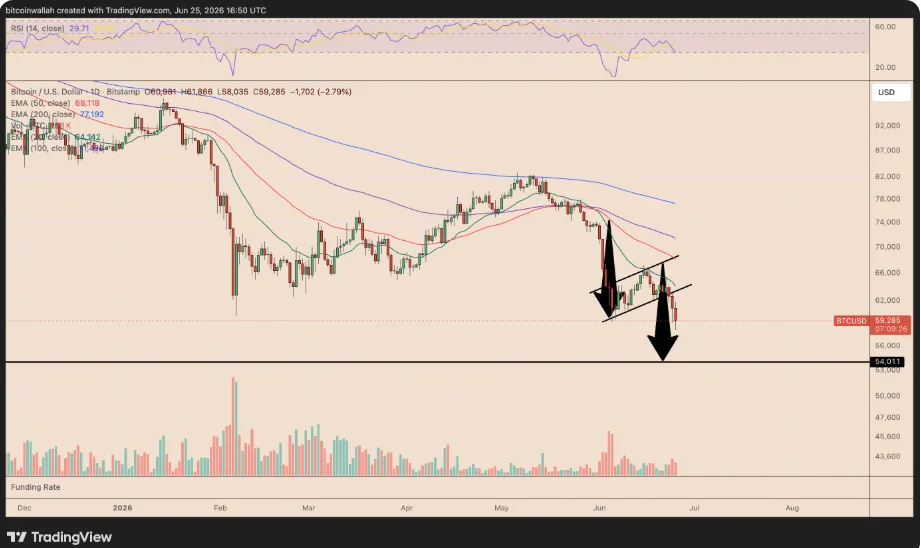
Interestingly, the projected downside target from the bear flag also aligns with the $54,000 area.
When different chart patterns across multiple timeframes produce similar price targets, traders often view the signal as stronger. The agreement between the four-hour and daily charts increases the possibility that Bitcoin may test this support if selling continues.
On-Chain Data Highlights $54,000 as a Key Support Zone
Technical analysis is not the only indicator pointing to the $54,000 level.
On-chain data from Glassnode’s Market Value to Realized Value (MVRV) pricing bands also identifies this area as an important support zone.
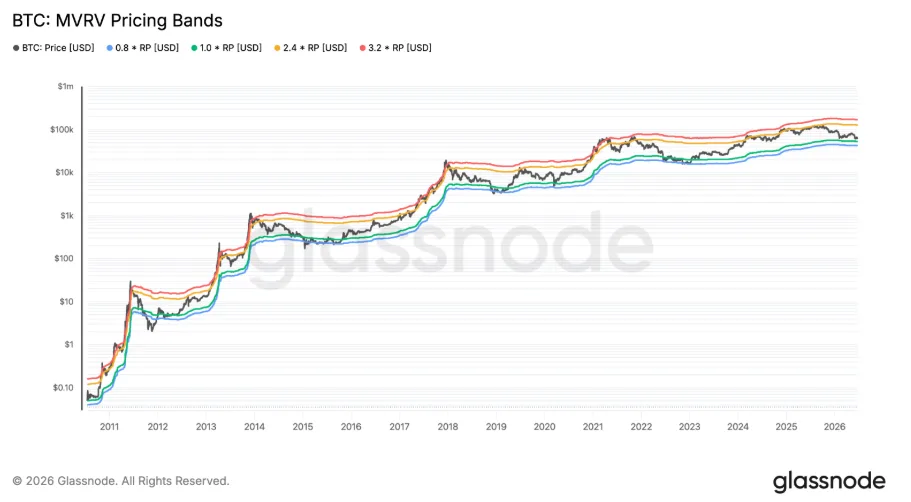
The MVRV model compares Bitcoin’s current market price with the average price at which coins last moved on the blockchain. It helps investors estimate whether Bitcoin is trading above or below its historical cost basis.
The 1.0 MVRV pricing band currently sits near $53,400, closely matching the technical target around $54,000. This alignment suggests the area could attract buying interest if the decline continues.
If selling pressure becomes much stronger, the next major historical support would be near the 0.8 MVRV band around $42,700. Previous Bitcoin bear market bottoms have formed close to this level when unrealized losses reached extreme levels.
Bitcoin Faces a Critical Test
Bitcoin now sits at an important crossroads after losing the $59,000 support level. Bearish chart patterns, weakening market sentiment, and on-chain data all point toward the $54,000 region as the next major level to watch. Whether buyers defend that area could determine whether the current correction stabilizes or deepens.
For now, traders are closely monitoring both technical signals and broader market conditions as Bitcoin attempts to find support.
ALSO READ: Ripple RLUSD Enters Japan After Regulatory Approval, Expanding Its Reach in Asia
DISCLAIMER:
The views and opinions expressed herein are solely those of the author and do not necessarily reflect the views of the publisher. The publisher does not endorse or guarantee the accuracy of any information presented in this article. Readers are encouraged to conduct further research and consult additional sources before making any decisions based on the content provided.
About the Author