
- Solana has rebounded from the key $60 support level, but bearish market signals and strong resistance continue to limit its recovery.
- Despite eight consecutive monthly losses, ongoing ETF inflows suggest institutional interest in SOL remains intact.
Solana (SOL) has recovered after defending the crucial $60 support level. However, SOL remains under pressure as bearish sentiment continues to dominate technical indicators and derivatives markets. While institutional interest remains visible through spot ETF inflows, SOL still faces several hurdles before a sustained recovery can begin.
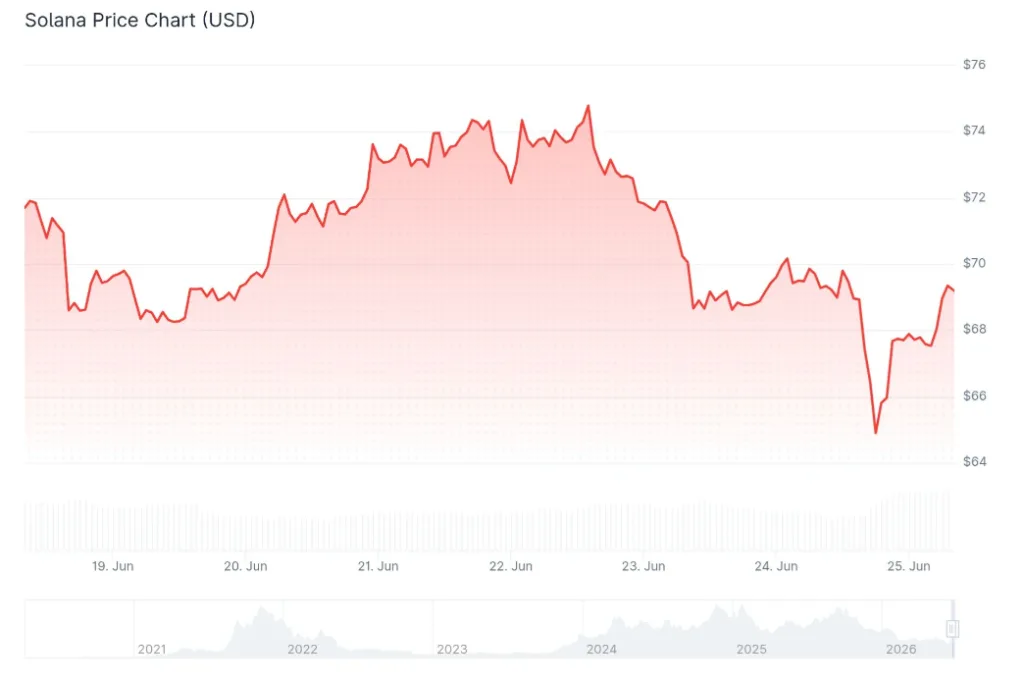
Solana Rebounds From Critical $60 Support
The $60 price zone has emerged as a major support level for Solana. Buyers stepped in at this area, helping SOL rebound by more than 5% at its strongest point during the recent recovery.
At the time of writing, SOL is trading within the $64 to $69 range. Despite the bounce, the token remains below several key exponential moving averages (EMAs), suggesting that sellers still maintain control of the broader trend.
The recovery has also failed to generate strong bullish conviction, with traders remaining cautious about the coin’s near-term outlook.
Bearish Signals Continue to Dominate Market Sentiment
Data from derivatives markets points to growing pessimism among traders. Solana’s long-to-short ratio recently dropped to 0.94, indicating that short positions now outnumber long positions. A reading below 1.0 often reflects expectations of further downside movement.
Funding rates have also turned negative, reaching -0.0080%. This means traders holding short positions are paying long holders, a situation that generally appears when market participants expect prices to fall further.
These metrics suggest that confidence in a strong recovery remains limited despite SOL’s recent rebound from support.
Technical Analysis Shows Key Resistance Ahead
Technical analyst BATMAN recently noted that SOL remains trapped inside a large symmetrical wedge pattern. As price action moves closer to the wedge’s apex, the market may be approaching a decisive breakout or breakdown.
Solana is reaching a decision point.$SOL is trapped inside a massive symmetrical wedge as volatility compresses toward the apex.
Price continues to struggle below the 200 EMA near $74 while MACD is printing bearish divergence and losing momentum.
Compression creates expansion… pic.twitter.com/Lu9sNKtcyH
— BATMAN ⚡ (@CryptosBatman) June 24, 2026
Adding to concerns, the Moving Average Convergence Divergence (MACD) indicator shows bearish divergence while SOL continues to trade below the 200-day EMA near $74. This setup often signals weakening buying strength.
Several resistance levels stand in the way of a larger recovery:
- $74.75 remains the first major resistance zone.
- The 50-day EMA sits near $76.18.
- The 50% Fibonacci retracement level stands around $79.27.
- The 100-day EMA is positioned near $83.03.
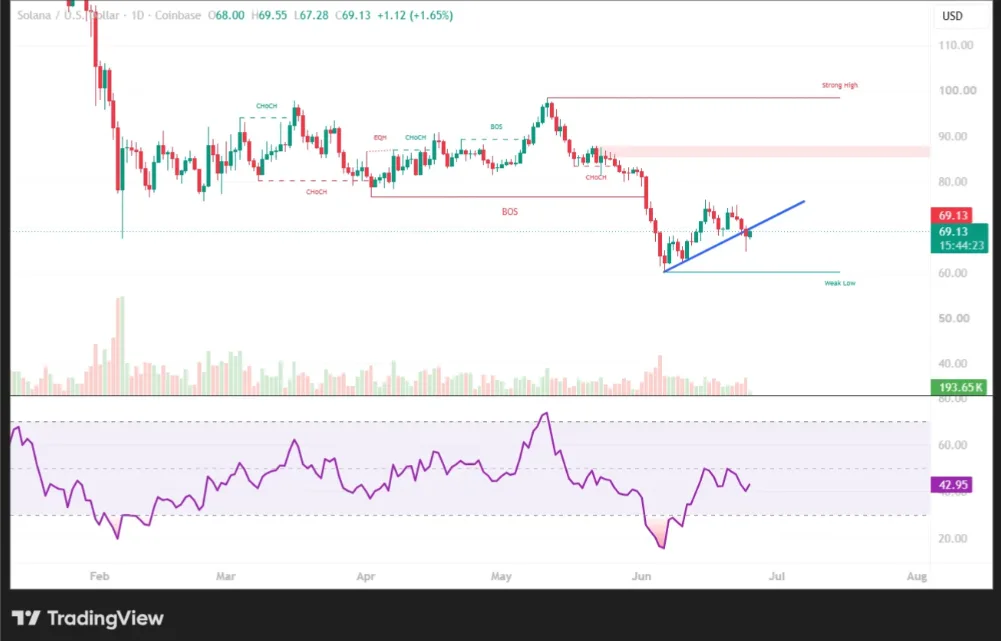
Meanwhile, the Relative Strength Index (RSI) remains around 46, below the neutral 50 level. This suggests buyers have yet to regain control.
Solana Records Longest Losing Streak in History
One of the most concerning developments for Solana is its monthly performance.
According to market analyst Ash Crypto, SOL has now posted eight consecutive monthly losses. This marks the longest losing streak since the token launched.
The monthly RSI has also fallen into deeper oversold territory than it did during the 2022 market collapse following FTX’s downfall. During that period, SOL dropped to roughly $8 before eventually recovering.
$SOL is the most oversold it has EVER been.
— Ash Crypto (@AshCrypto) June 6, 2026
– Solana just hit a 3-year low of $60.
– Down -80% from its ATH.
– 8 consecutive red monthly candles for the first time in history.
– $SOL Monthly RSI is more oversold than the 2022 FTX crash when sol crashed to $8.
Do you think the… pic.twitter.com/XrQs1444SA
Although oversold conditions can sometimes signal a potential bottom, they do not guarantee an immediate reversal.
Institutional Interest Offers Hope for Recovery
Despite the bearish technical outlook, some positive signs continue to emerge.
Spot Solana ETFs attracted approximately $137,290 in net inflows on Tuesday. While the figure is relatively small, it highlights ongoing institutional interest in the asset.
Some analysts are also watching the $50 to $40 range as a potential long-term accumulation zone. If SOL establishes a strong base in this area, some projections suggest a recovery toward $175 could become possible over time.
Other long-term market observers believe Solana could eventually reclaim previous highs and potentially move above $300 if broader market conditions improve.
What Comes Next for Solana?
Solana remains at a critical crossroads. The successful defense of the $60 support level has prevented further immediate losses, but bearish sentiment continues to weigh on price action.
For bulls, reclaiming resistance levels between $74 and $83 will be essential to confirm a stronger recovery. On the downside, support around $62 to $63 remains crucial; a break below this area could open the door to another test of lower levels.
While institutional inflows provide some encouragement, traders will likely continue monitoring technical indicators and market sentiment closely as SOL attempts to regain strength in the weeks ahead.
ALSO READ: TRON Surpasses Ethereum and Solana With Nearly 4 Million Daily Active Addresses
DISCLAIMER:
The views and opinions expressed herein are solely those of the author and do not necessarily reflect the views of the publisher. The publisher does not endorse or guarantee the accuracy of any information presented in this article. Readers are encouraged to conduct further research and consult additional sources before making any decisions based on the content provided.
About the Author