
- Ethereum has declined about 5% this month as whale selling and ETF outflows weigh on the market.
- Network activity and DeFi TVL are weakening.
- Technical patterns suggest more downside if $3,000 support breaks.
Ethereum (ETH) has struggled to regain strength after recent declines, with whale selling and weakening institutional interest signaling potential further downside. Currently trading around $3,115, ETH is down roughly 5% this month and more than 36% since its all-time high of $4,867 in August last year.
Whale Activity and ETF Outflows Weigh on Ethereum
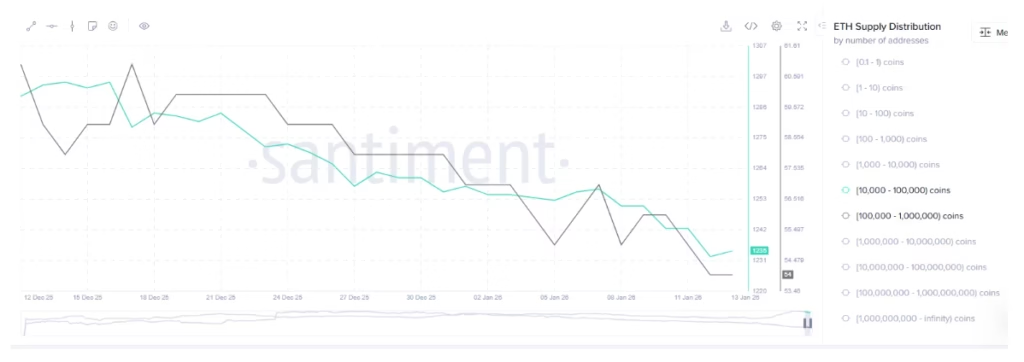
Data from Santiment reveals a steady decline in wallets holding between 10,000 and 1 million ETH since mid-December. Large-scale offloading by whales often triggers panic among retail investors, intensifying selling pressure.
Institutional demand has also cooled. U.S. spot Ethereum ETFs have seen outflows exceeding $345 million over the past four trading sessions, according to SoSoValue. Reduced interest from institutional investors may be discouraging retail traders, leaving the market hesitant.
Weak On-Chain Fundamentals Add to Concerns
Ethereum’s network activity and DeFi usage show signs of weakening. DeFiLlama reports that total value locked (TVL) across Ethereum-based DeFi protocols has dropped from a September peak of $257 billion to $175 billion. Declining TVL suggests slower network usage and lower capital inflows, reflecting a potential erosion of confidence in Ethereum’s ecosystem.
Derivative market data also points to waning speculative interest. CoinGlass shows that Ethereum futures open interest has fallen from $70 billion in August to $39 billion currently, highlighting a decline in trading activity and investor engagement.
Technical Patterns Hint at Potential Downside
On the daily chart, Ethereum has formed a multi-month symmetrical triangle, a pattern that often precedes bearish continuation. Additionally, an inverse cup and handle pattern is visible, with the neckline at $2,619. A break below the $3,000 psychological support could open the path toward this key level, potentially leading to further losses down to $2,121 if bearish momentum persists.
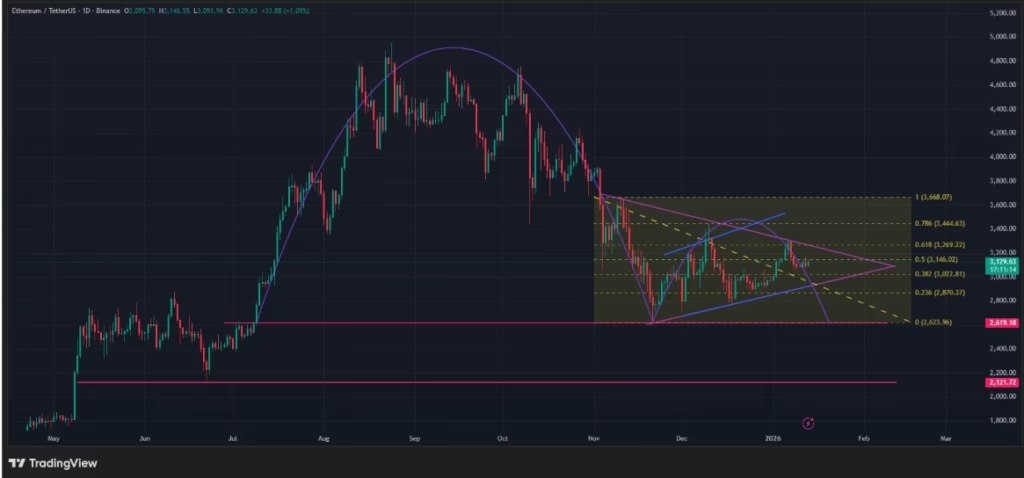
Conversely, a rebound above the $3,269 resistance, coinciding with the 61.8% Fibonacci retracement, could invalidate the bearish outlook and encourage a recovery toward higher price targets.
Investors are likely to monitor these technical and on-chain indicators closely in the coming days, as Ethereum’s trajectory may hinge on whether it can hold key support levels or faces intensified selling pressure.
ALSO READ: Terra Classic (LUNC) Tests Key Support Ahead of Do Kwon Trial on January 26
DISCLAIMER:
The views and opinions expressed herein are solely those of the author and do not necessarily reflect the views of the publisher. The publisher does not endorse or guarantee the accuracy of any information presented in this article. Readers are encouraged to conduct further research and consult additional sources before making any decisions based on the content provided.
About the Author