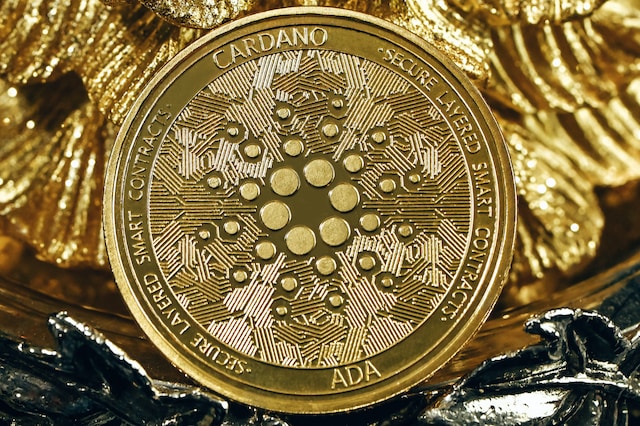
- Cardano experiences a surge in whale activity, with 25 billion ADA tokens transferred within 24 hours, signaling significant movements by major players.
- Despite price volatility, technical analysis suggests potential bullish momentum as ADA tests key support and resistance levels, while market sentiment and whale transactions continue to shape short-term price dynamics.
The Cardano blockchain has been abuzz with activity as a staggering 25 billion ADA tokens were transferred within a mere 24 hours. Such substantial movements signify the actions of major players within the cryptocurrency space, potentially indicating strategic maneuvers by whales or institutional investors. Despite the underlying strength of Cardano’s fundamentals, its price has experienced notable volatility in recent weeks.
Cardano (ADA) Sees 25 Billion Tokens Transferred in 24 Hours: What's Going On? #Cardano #cardanofeed #trading #ADA #crypto #CardanoCommunity #bitcoin #blockchain @otaviolima #cryptocurrency #CardanoADA #btc $ADA https://t.co/SCH8cEIJxC
— Cardano Feed ($ADA) (@CardanoFeed) April 24, 2024
As of April 25th, 2024, ADA is trading around the $0.47 mark, marking a decline of 6.57% over the past 24 hours and a substantial 26.99% decrease in the last 30 days. With a market cap of $16.9 billion, ADA currently holds the 10th position in the cryptocurrency market, trailing behind Toncoin.
The heightened trading volume, exceeding $502 million over the past 24 hours, reflects a 23.75% increase, suggesting active market participation. Analysts interpret these sizable on-chain transactions as precursors to potential significant price movements in the near future.
Large transactions of this magnitude by cryptocurrency whales often foreshadow volatile price swings. Such movements typically indicate significant players either capitalizing on profits or strategically positioning themselves for an anticipated market rally or downturn. Notably, the recent surge in large ADA transactions peaked at a remarkable 27.67 billion tokens transferred.
The question that arises amidst this flurry of activity is whether these whale transactions will serve as a catalyst for a surge in Cardano’s price or trigger a substantial sell-off. Conducting a technical analysis offers some insights into potential outcomes.
ADA Technical Analysis
On the weekly chart, ADA appears to be gaining bearish momentum following a previous bullish close. Since March 14th, when Cardano encountered resistance after reaching $0.81, it has predominantly trended bearish, with most weekly candles closing in the red. While last week exhibited a bullish close, the current week appears to be reverting to a bearish trend. The critical question remains: Is this a retracement to the downside or a continuation of bearish sentiment, potentially breaching crucial support levels?
On the daily timeframe, ADA is currently trading above a significant support zone around $0.445, a level previously met with rejection. The price is now approaching an ascending trendline resistance at $0.60, breached on April 11th. With the Relative Strength Index (RSI) at 39, nearing oversold levels, there might be room for increased buying pressure to test these resistance levels. A bullish scenario could lead to a move to fill the fair value gap below the $0.60 ascending trendline resistance. However, if bears regain control, a retest of the $0.445 support level remains a possibility.
Over shorter timeframes, such as the 4-hour chart, ADA’s price has been consolidating within a range of $0.45 to $0.52 as traders anticipate the next major directional move.
While the Cardano ecosystem continues to expand rapidly, with new projects and applications bolstering its long-term potential, short-term price dynamics remain influenced by market sentiment and whale activity. The market’s response to these fluctuations will determine whether ADA can reclaim its bullish momentum or succumb to further selling pressure.


