- Pi Network faces growing selling pressure as large token inflows hit exchanges and technical indicators turn bearish.
- Price action near the $0.20 level suggests downside risk remains elevated.
Pi Network is showing signs of weakness as selling pressure builds, raising concerns about its short-term price direction. Recent market activity suggests that traders remain cautious, with technical indicators leaning bearish and on-chain data pointing to reduced confidence among holders.
Exchange Deposits Point to Rising Supply Pressure
Pi Network is trading near the $0.20 level after recording a nearly 2% decline in the previous session. This zone holds psychological importance, but recent data shows mounting pressure. Over the past 24 hours, approximately 1.90 million PI tokens moved into centralized exchanges. Such inflows often suggest that holders may be preparing to sell rather than hold.
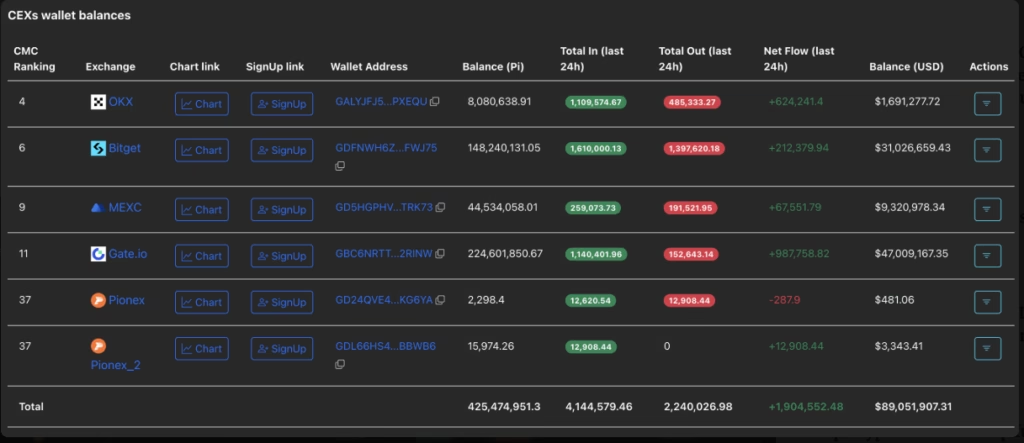
Large token deposits into exchanges typically increase available supply in the market. This trend can weigh on price, especially when demand appears limited. The steady rise in exchange balances reflects a risk-off approach, with investors choosing liquidity over long-term exposure.
Technical Indicators Remain Bearish
From a technical perspective, Pi Network continues to struggle below key moving averages. The price is testing the 20-day Exponential Moving Average near $0.209, after facing rejection at the 50-day EMA around $0.216. This rejection suggests that sellers remain active at higher levels, preventing sustained recovery attempts.
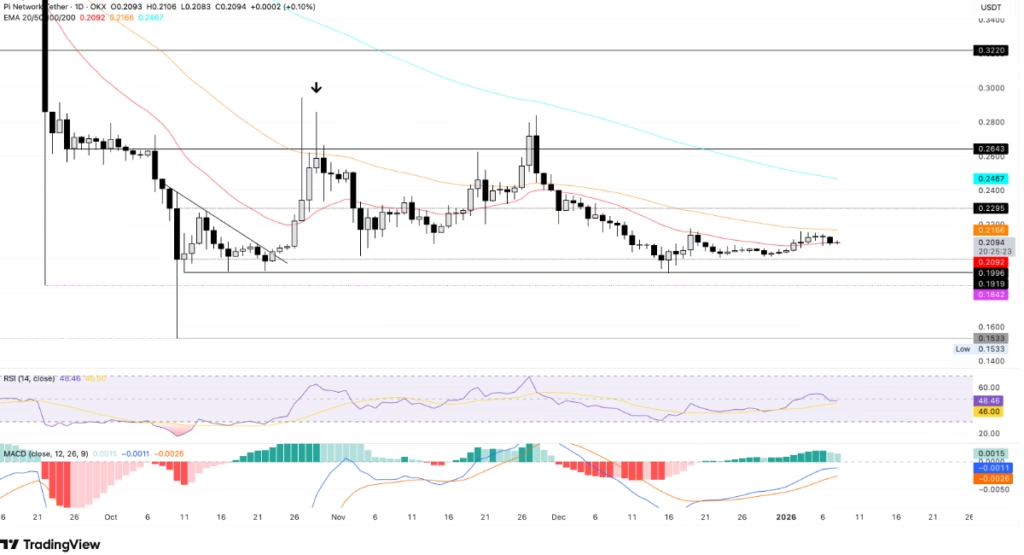
The Relative Strength Index has slipped to 48, moving below the neutral midpoint. This shift indicates that selling pressure currently outweighs buying interest. While the RSI has not yet reached oversold territory, the downward trend leaves room for further declines if market conditions do not improve.
The Moving Average Convergence Divergence indicator also reflects weakening conditions. The shrinking green histogram bars point to fading buying strength. A confirmed crossover below the signal line would further reinforce the bearish outlook.
Key Levels to Watch in the Short Term
If Pi Network fails to hold above $0.20, historical support zones may come into focus. The October 11 low near $0.1996 stands as the first area of interest. A deeper decline could expose the September 22 low around $0.184, which previously attracted buyers.
On the upside, any meaningful recovery would require a clear move above the 50-day EMA. A successful breakout could open the door toward the $0.229 region, last tested in early December. Until that happens, the broader outlook remains cautious.
Outlook Remains Cautious
Overall, Pi Network faces a challenging phase as exchange inflows, weakening indicators, and repeated resistance levels limit upside potential. Unless buying interest strengthens and supply pressure eases, the token may continue to face downside risks in the near term.
ALSO READ: Pi Network Activates Testnet 25 as January Mainnet Vote Nears
DISCLAIMER:
The views and opinions expressed herein are solely those of the author and do not necessarily reflect the views of the publisher. The publisher does not endorse or guarantee the accuracy of any information presented in this article. Readers are encouraged to conduct further research and consult additional sources before making any decisions based on the content provided.
About the Author