- Solana faces continued selling pressure as record ETF outflows and large exchange deposits weaken investor demand.
- SOL’s $88.91 support level is crucial, with a break below it potentially triggering further losses.
Solana (SOL) is struggling to hold above $92 as selling pressure builds, with $88.91 emerging as a key support level. The decline follows record outflows from US spot Solana exchange-traded funds (ETFs) and increased deposits of SOL to exchanges, adding to concerns about further losses.
SOL was trading at $92.11, down 2.3% over the past 24 hours. Its price remains below the 20-period and 50-period moving averages, while the 200-period average at $88.91 is the next major level bulls need to defend.
Solana ETF Outflows and Exchange Deposits Add to Selling Pressure
Institutional demand for Solana has weakened following a record $71.47 million in net outflows from US spot Solana ETFs last week. This marked the largest weekly withdrawal since the funds launched, suggesting investors have become more cautious about SOL’s near-term outlook.
Selling pressure has also increased as large holders move tokens to exchanges. Data cited in the analysis showed that 1.49 million SOL, worth approximately $148.77 million, was deposited to exchanges during the 10 days leading up to November 2.
Large exchange deposits can increase the available supply of tokens for sale, adding pressure when market demand is already weak.
However, Solana’s network activity continues to show signs of growth. Tokenized stock trading volume reached $3.9 billion in October, supported by more than 500,000 holders. Meanwhile, application revenue increased by 48% in the third quarter of 2026, while spot decentralized exchange (DEX) trading volume reached $197.2 billion.
These figures highlight continued activity across the Solana ecosystem, although growing network usage has yet to translate into stronger SOL price performance.
SOL Price Remains Below Key Moving Averages
Solana’s technical indicators currently favor sellers. On the hourly chart, SOL trades below its 20-period moving average at $92.61 and its 50-period moving average at $93.94.
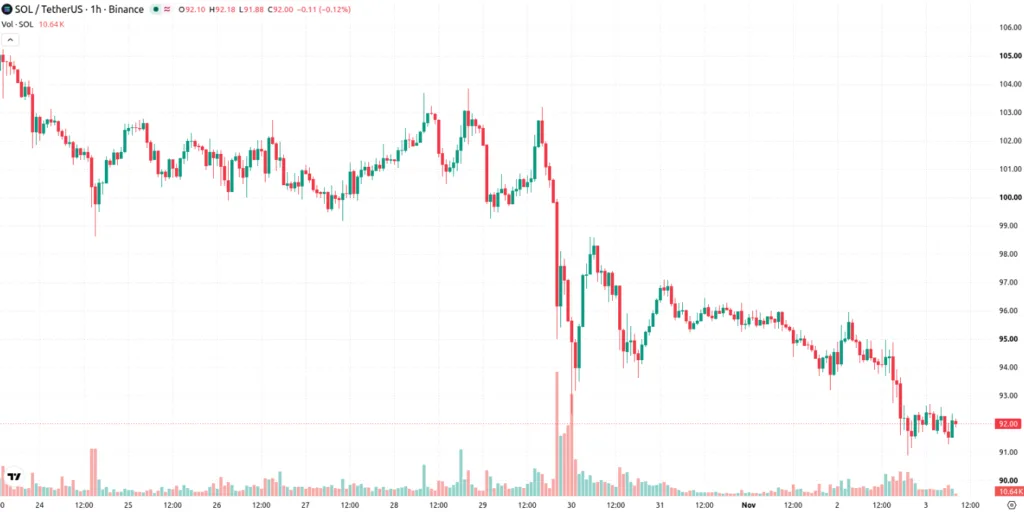
The 200-period moving average at $88.91 remains an important support level. As long as SOL stays above this level, the longer-term technical structure retains some support despite the recent weakness.
The Ichimoku Kijun line at $93.01 also acts as immediate resistance. A recovery above this level could help ease some of the selling pressure, but SOL would still need to reclaim higher moving averages to strengthen its short-term outlook.
Other technical indicators reinforce the bearish picture. The Relative Strength Index (RSI) stands at 33.39, indicating weak buying momentum. Meanwhile, the Moving Average Convergence Divergence (MACD) signals a strong sell, with the Average Directional Index (ADX), Commodity Channel Index (CCI), and Bull/Bear Power also pointing toward continued selling pressure.
Can Solana Hold the $88.91 Support Level?
Solana is expected to trade within a range of $89.21 to $95.01 over the next two to three trading days, according to the technical analysis.
The immediate focus remains on whether buyers can defend the $89.21 area and prevent a deeper decline toward the $88.91 moving average.
A break below $89.21 could expose SOL to further losses, particularly if ETF withdrawals and exchange deposits continue to increase selling pressure.
On the upside, a move above $93.01 would be an early sign of improving momentum. However, a stronger recovery would require SOL to reclaim the $92.61 and $93.94 moving averages.
For now, the combination of record ETF outflows, increased exchange deposits, and bearish technical indicators leaves Solana vulnerable to further downside. Despite continued growth in network activity, the $88.91 support level remains a key price area for traders to watch.
ALSO READ: Pi Network Rolls Out New Features for Developer Portal, BlockExplorer, SoloHost and PiVerify
DISCLAIMER:
This article reflects the author’s views and is provided for informational purposes only. While we strive for accuracy, the publisher does not guarantee that all information is complete or current. Readers should verify important information and consult appropriate sources before making decisions based on this content.
About the Author