- Solana trades near $89 as it tests $90.24 resistance with weak strength and mixed signals.
- Institutional growth supports long-term outlook despite short-term consolidation.
Solana is trading near $89 after posting modest daily gains. The coin remains above short- and medium-term moving averages but continues to trade below its long-term trend level.
Institutional Activity and Network Development
Solana has seen increased institutional activity alongside growing network usage in real-world applications. Reports indicate that real-world asset activity on the network has expanded significantly since early last year, reflecting higher on-chain engagement.
A new stablecoin payment platform, Pay.sh, was also launched with involvement from Google Cloud. The platform focuses on automated payment systems for digital transactions and AI-related applications. It is presented as part of broader payment infrastructure development within the Solana ecosystem.
Additional developments include partnerships with financial institutions and acquisitions in the broader digital asset sector, along with plans to expand tokenized asset offerings. These updates reflect ongoing efforts to build out Solana’s financial and trading infrastructure.
Solana Price Action and Technical Picture
Solana is currently trading near $89, slightly above its short-term moving averages, including the SMA-20 and SMA-50. However, it remains below the longer-term SMA-200 level, indicating that broader trend recovery is still limited.
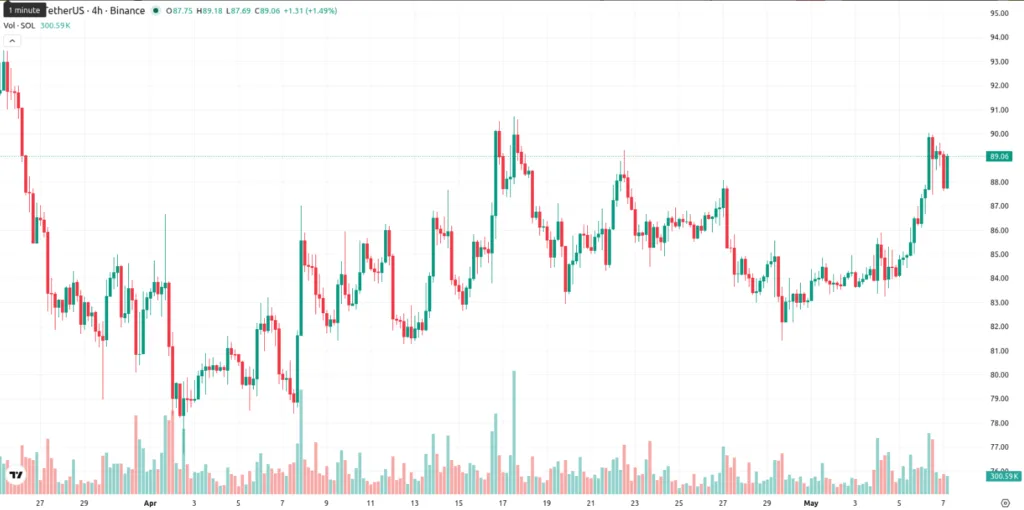
Technical indicators show mixed conditions. Momentum indicators such as MACD and ADX remain weak, suggesting the absence of a strong directional trend. At the same time, oscillators like RSI and Stochastic RSI indicate that the asset is approaching overbought territory.
Trading activity shows moderate volatility, with price movement contained within a narrow intraday range. This reflects ongoing indecision between buyers and sellers near current levels.
Key Resistance at $90.24
The $90.24 level remains a key resistance zone for Solana in the short term. Price action has repeatedly tested this area without a decisive breakout.
If Solana moves above this level, short-term upside potential may open. However, stronger resistance from long-term averages could still limit sustained gains.
On the downside, support is located near $88.93. A break below this level could lead to further downside pressure as overbought conditions normalize.
Market Outlook Remains Range-Bound
Short-term projections suggest Solana may continue trading within a narrow range between $88.93 and $90.24.
Current indicators do not show strong momentum for a breakout in either direction. This increases the likelihood of consolidation unless a clear catalyst emerges.
Overall, market conditions point to a neutral short-term structure, with traders watching closely for a confirmed move beyond key resistance or support levels.
ALSO READ: Michael Saylor Ends “Never Sell” Era as Strategy Signals First Bitcoin Sale Amid Dividend Pressure
DISCLAIMER:
The views and opinions expressed herein are solely those of the author and do not necessarily reflect the views of the publisher. The publisher does not endorse or guarantee the accuracy of any information presented in this article. Readers are encouraged to conduct further research and consult additional sources before making any decisions based on the content provided.
About the Author