


- Solana (SOL) recently plummeted to a 30-day low of $82 amidst a broader downturn in the altcoin market.
- The article explores the factors contributing to SOL’s decline, citing bearish sentiment, shrinking altcoin market cap, and decreasing derivatives market interest, ultimately forecasting a potential further drop to $75.
Exploring the Factors Driving Solana’s Decline and Predicting Potential Price Targets
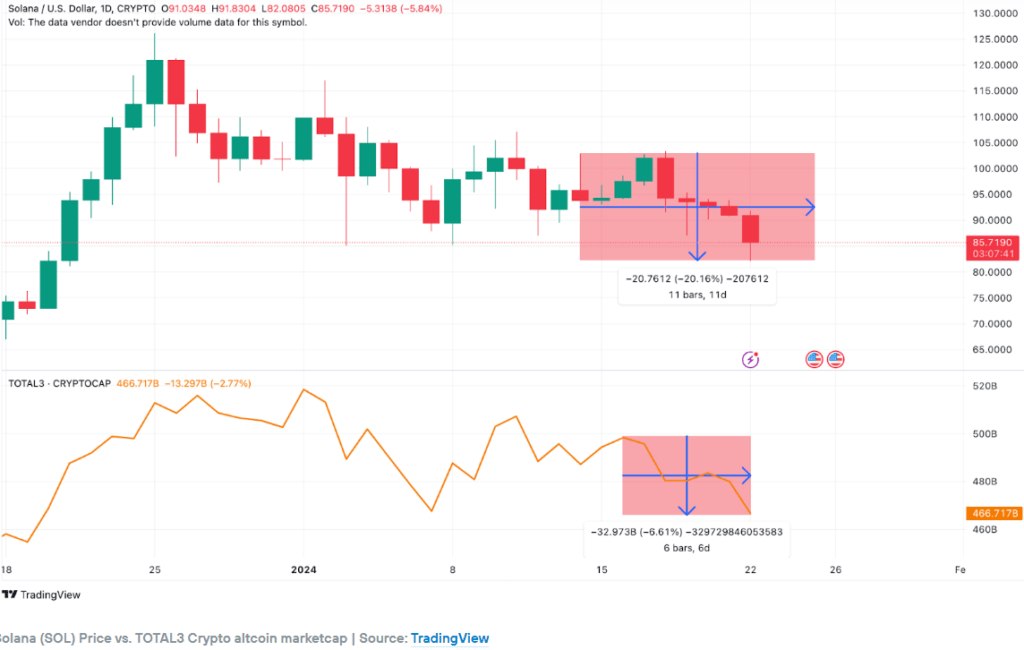
Solana (SOL) recently experienced a significant setback, sliding to a 30-day low of $82 on January 22. This decline follows the crypto market’s broader trend as investors trim their mega-cap altcoin holdings. Despite being one of the top-performing mega-cap altcoins during the pre-Bitcoin ETF rally, SOL has seen a downturn since reaching a 2-year peak of $126.1 on December 25.
On-chain Insights into Solana’s Decline
While the Solana network has displayed robust growth metrics, including increasing network usage and daily active users, the price dropped to $82 on January 22, marking a 20% loss within the week. The bearish sentiment affecting the broader altcoin market, as reflected in TradingView’s TOTAL3 chart, has been a key driver of SOL’s decline.
The TOTAL3 chart reveals an 8% downtrend in the global altcoin market cap, excluding Bitcoin (BTC) and Ethereum (ETH). With the total altcoin market shrinking by $32 billion in the past week, it’s evident that investor confidence in the sector is waning, impacting SOL disproportionately as the 8th largest cryptocurrency.
Derivatives Market Signals Caution
In the derivatives market, SOL investors are bracing for further downside as they close out positions. Santiment’s open interest data indicates a $226 million decrease in SOL open interest since January 17, reflecting a 20% decline in price.
The decline in open interest signals growing disinterest among investors, with more exiting positions than entering. This negative sentiment is a substantial contributor to SOL’s ongoing price downtrend.
Forecasting SOL’s Future
Considering the trends in derivatives and market data, SOL’s price could head towards $75 in the coming days. Bollinger bands technical indicators support this bearish outlook, with SOL trading below the 20-day Simple Moving Average price of $93. This suggests investors are willing to pay less for SOL than they were just 20 days ago.
While there might be a potential rebound around the lower-Bollinger band at $85, failure to hold that level could see SOL sliding further towards the $75 mark. As the crypto market navigates through volatile conditions, investors are advised to closely monitor these indicators to make informed decisions in the ever-changing landscape of digital assets.


+ There are no comments
Add yours