- Solana is holding near $88 as it builds pressure within a triangle pattern, supported by rising ETF inflows and futures activity.
- A breakout above $89 could open a path toward $100, while failure may trigger a short-term pullback.
Solana is showing renewed strength as it trades near key technical levels and attracts fresh institutional and retail interest. The market is now watching whether SOL can break out of its current triangle pattern and extend its recovery.
Solana Holds Above Key Moving Average Support
Solana (SOL) is trading near $88 and holding above its 50-day Exponential Moving Average (EMA) at $87.04. This level is acting as short-term support and helping stabilize price action.
The token is also moving within a symmetrical triangle pattern on the daily chart. This structure often signals a strong breakout move once the price clears resistance or breaks support.
At the moment, Solana is pressing toward the upper boundary of this pattern near $89.
ETF Inflows Point to Renewed Institutional Interest
Solana exchange-traded funds (ETFs) are showing signs of recovery in investor demand.
Recent data shows:
- $9.44 million net weekly inflows after previous strong buying activity
- A prior week’s inflow of $35.17 million
- Only a small Friday outflow of $1.17 million
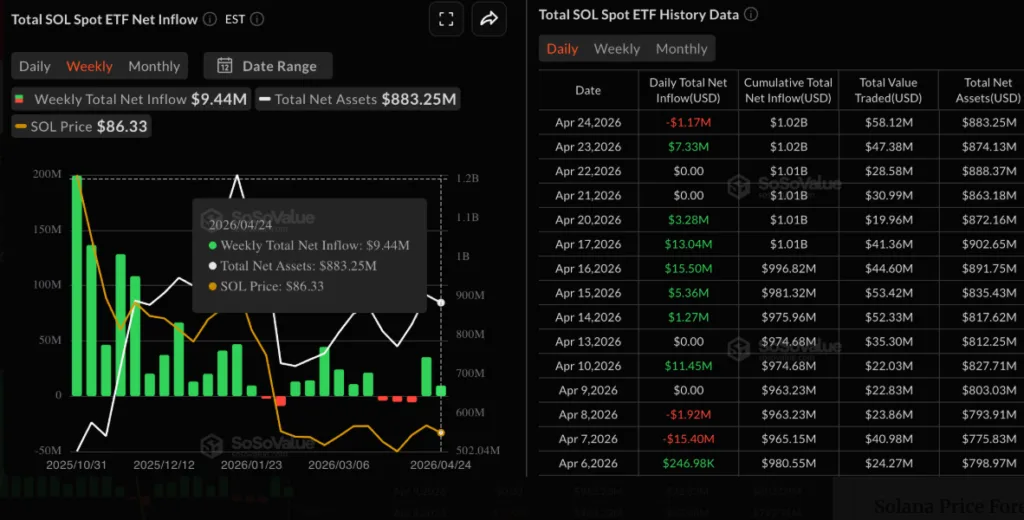
These figures suggest that institutional interest is returning after a brief slowdown. Consistent inflows often support price stability and longer-term upside moves.
Rising Futures Activity Signals Retail Participation
Derivatives data is also turning positive for Solana.
Key indicators include:
- Open Interest rising over 2% to $5.23 billion
- Funding rate increasing to 0.0095%
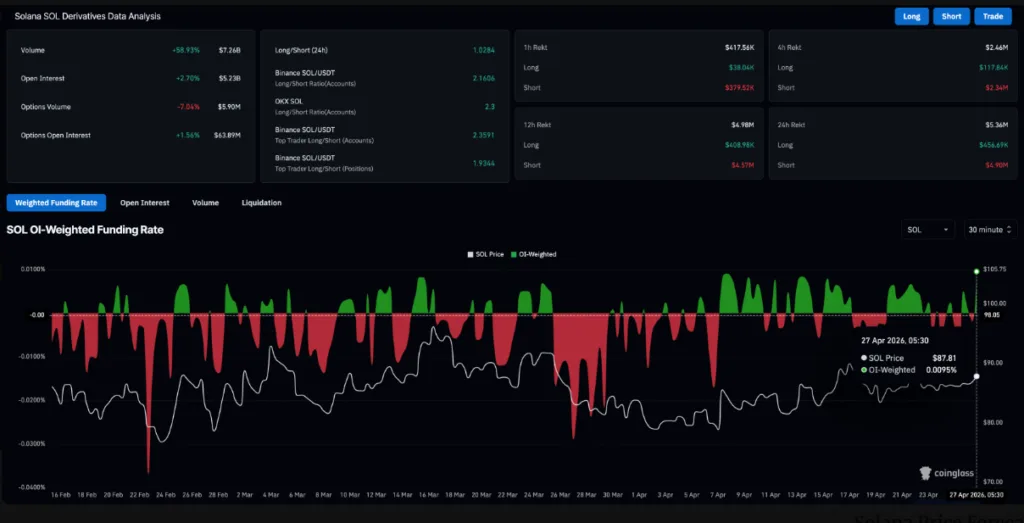
Higher Open Interest shows that more traders are entering positions. A positive funding rate also indicates that long positions are in control, with traders paying a premium to stay bullish.
This combination reflects growing retail participation alongside institutional activity.
Technical Outlook Shows Pressure Near Resistance
Solana is now approaching a critical resistance zone around $89. This level aligns with the upper trendline of the triangle pattern.
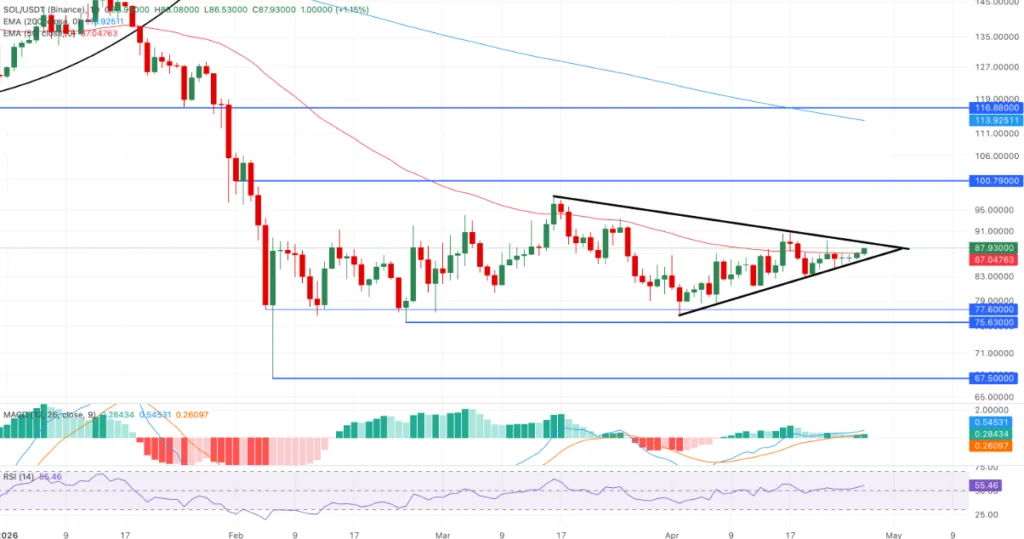
If buyers push above this area, the next targets become:
- $100 psychological level
- $113 near the 200-day EMA
Momentum indicators are also improving:
- RSI is at 55, moving above the midpoint
- MACD is rising into positive territory
These signals suggest that buyers are slowly gaining control, but resistance remains a key barrier.
Key Support Levels to Watch
If Solana fails to break higher, support levels remain important:
- $87.04 at the 50-day EMA
- $85.99 near the rising trendline
A daily close below $85.99 could weaken the current bullish structure and lead to a deeper pullback.
Final Outlook for Solana
Solana is at a decisive point in its price structure. ETF inflows, rising futures activity, and improving technical indicators all support a potential breakout.
However, the $89 resistance level remains the key trigger. A clear move above it could open the path toward $100 and beyond, while rejection may keep SOL inside its current range.
ALSO READ:Chainlink CCIP Explained: How Secure Cross Chain Infrastructure Powers Onchain Finance
DISCLAIMER:
The views and opinions expressed herein are solely those of the author and do not necessarily reflect the views of the publisher. The publisher does not endorse or guarantee the accuracy of any information presented in this article. Readers are encouraged to conduct further research and consult additional sources before making any decisions based on the content provided.
About the Author