
- XRP has entered a stop-loss phase as on-chain data shows coins are being sold at a loss, mainly by smaller holders.
- Technical indicators suggest further downside, with $1.35–$1.30 as the next potential support zone.
XRP has entered a critical stop-loss phase as on-chain profitability turns negative, marking a challenging period for the cryptocurrency. Recent market data shows that selling pressure is accelerating, particularly among smaller holders, while whales remain largely inactive.
Stop-Loss Selling Drives XRP Down
According to on-chain data, XRP’s 7-day Spent Output Profit Ratio (SOPR) has fallen to 0.96, its first sustained move below 1.0 since 2022. This signals that, on average, holders are selling coins at a loss, pushing the market into a stop-loss phase. Glassnode analysts highlighted that XRP has now dropped below the aggregate cost basis of its holders, a condition historically associated with consolidation periods and sideways price action.
XRP lost its aggregate holder cost basis, triggering panic selling.
• SOPR (7D EMA) fell from 1.16 (Jul ’25) to 0.96 (now)
• Holders are realizing significant losses
• On-chain profitability flipped negative
This setup closely resembles the Sep 2021–May 2022 phase, where SOPR… https://t.co/FejyV1CiuU pic.twitter.com/MYo27V6hTf— glassnode (@glassnode) February 9, 2026
Smaller investors appear to be the main source of selling, contrasting with previous rallies, such as in July 2025, when whales dominated market exits. CryptoQuant data confirms that whale-to-exchange flows remain near historical lows, suggesting that major players are holding off selling until prices recover.
Technical Indicators Suggest More Downside
XRP’s daily chart shows persistent lower highs, reinforcing a broader downside bias. Both the 50-day and 100-day moving averages are now acting as resistance levels, capping upside attempts. Bollinger Bands indicate that the price is gravitating toward the lower band, reflecting settling volatility and a lack of stable range formation.
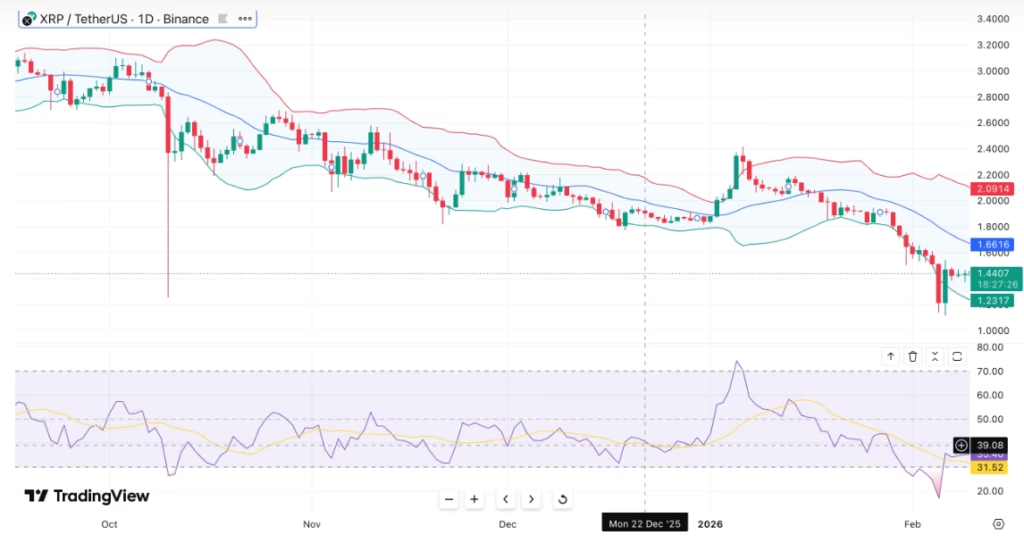
The daily Relative Strength Index (RSI) remains below neutral, suggesting weak upward momentum. Attempts to reclaim the $1.45–$1.50 support zone have failed, confirming strong overhead supply. Without a significant rebound, XRP could test the $1.35–$1.30 support zone, a level that previously saw buying interest in late 2024. A close below $1.30 could open the door to further declines toward $1.20.
Market Activity Shows Active Repositioning
Despite the price decline, trading activity has increased. Spot volume climbed 22% to $3.45 billion over 24 hours, while futures volume rose 12% to $5.66 billion. Open interest dipped slightly by 0.17%, signaling that traders are closing positions rather than adding new leverage. This pattern suggests active repositioning rather than panic selling.
XRP is currently trading around $1.44, down roughly 10% over the past week and over 40% in the last year. While smaller holders continue to drive stop-loss selling, the pause in whale activity may eventually lead to sideways consolidation or short upward spikes, as seen in historical patterns.
ALSO READ: Solana Price Could Drop Toward $72 if $80 Support Breaks
DISCLAIMER:
The views and opinions expressed herein are solely those of the author and do not necessarily reflect the views of the publisher. The publisher does not endorse or guarantee the accuracy of any information presented in this article. Readers are encouraged to conduct further research and consult additional sources before making any decisions based on the content provided.
About the Author